In the Global Hunger Index (GHI) released last week, India’s ranking slipped seven places to a rank of 101 from 94, in over just a year. The index gives a score on a 100 point scale, where zero indicates no hunger and 100 shows an “extremely alarming” situation. With a score of 27.5, the level of hunger in India is “serious”.
The COVID-19 pandemic and the socio-economic crisis of ‘access inequality’ has exacerbated across India (and much of the developing world), and has surely made the situation of ‘access to basic nutrition’ worse, especially for those positioned at the bottom of the income-and-social pyramid.
In an essay written during the early days of the pandemic’s first wave, I had then argued — with some empirical detail — how ‘nutritional outcomes’ across India will be severely affected with growing levels of ‘food insecurity’ and rising poverty, which an ad-hoc (national) lockdown further accentuated.
Notwithstanding the sufferings caused by the pandemic — and the national government’s insensitive response to it — it becomes critical to widen our discourse from just measuring, or analysing the distributive ‘access to food/nutrition’ in India to also include the broader nature of ‘access inequality’ as relevant for ‘basic amenities’ (i.e. roti, kapda, makaan, paani, etc.) to populations in states across India.
While the Government of India has recently questioned ‘the unscientific methodological flaws’ present in the GHI’s design (without much empirical detail), what we can do here is to look at another relatable composite metric to see if the raised direction of concern — as pointed by GHI in its 2021 report — is further substantiated by the empirical data available on basic amenities, and not just for food and nutrition, for all states across India.
In a recent study undertaken by the Centre for New Economics Studies (CNES), O.P. Jindal Global University, a few of us attempted to conceptualise the creation of a new index — the Access (In)equality Index (AEI) — envisioning to measure and study differential inequality of access in terms of access to basic social and economic services and opportunities through the constitution of five ‘access’ pillars, for states and union territories across India.
The best performers in our study were categorised as ‘Front Runners’, the average performers as ‘Achievers’ and the below average performers as ‘Aspirants’ (see the report here for more details). In context to this discussion (i.e. around the GHI’s recent findings), let’s look into one of the measured pillars of assessment as done for our study, where the score of states under the access to basic amenities pillar reflects some stark realities, warranting everyone’s attention.
What did the AEI find?
As seen in Figure 1 below, Goa followed by Punjab, Kerala, Sikkim, Haryana, Mizoram, Gujarat, Maharashtra and Telangana are front runners (index value > 0.71) owing to the fact that the basic amenities in terms of drinking water, sanitation, housing, clean energy, nutrition and digital access out-par other states in India.
Figure 1: State-Level Performance on ‘Access to Basic Amenities’.
Source: Access (In)Equality Report 2021
Figure 2: Access to Basic Amenities: Ranking for Union Territories (UTs).
Source: Access (In)Equality Report 2021
Goa’s high score is driven by a high score across access to drinking water, functional toilets, good quality housing, clean fuel, food through PDS and the internet. The index values for achievers lie between 0.52-0.71. On the other hand, aspirants including Jharkhand, Odisha, Tripura, Uttar Pradesh, Madhya Pradesh, Chhattisgarh, Bihar, West Bengal, Meghalaya and Mizoram have underperformed.
In terms of UTs (see Figure 2 above), Chandigarh, Delhi and Puducherry are top performers. Performance of Chandigarh across all the indicators is extraordinary. Approximately 98% of the household has water supply within the premise; 100% of the household in Chandigarh has access to both latrines and water in latrines.
Access to sanitation, housing and nutrition in Delhi is also striking. Also, the internet and mobile users in Puducherry and Delhi is relatively high. Smaller geographical coverage, more focused implementation-driven welfare policies make most UTs to perform differently from States.
Figure 3: (In)Equality of What Among Basic Amenities.
Source: Access (In)Equality Report 2021
Within the sub-indicators extrapolated from our data in Figure 3, the worst performing states/UTs on measuring proximate access to piped drinking water feature Bihar; on sanitation is Odisha; on housing is Manipur; on clean energy is Odisha; on nutrition is Puducherry, and on digital access is Tripura.
Let’s break this further down to each sub-category (within access to basic amenities).
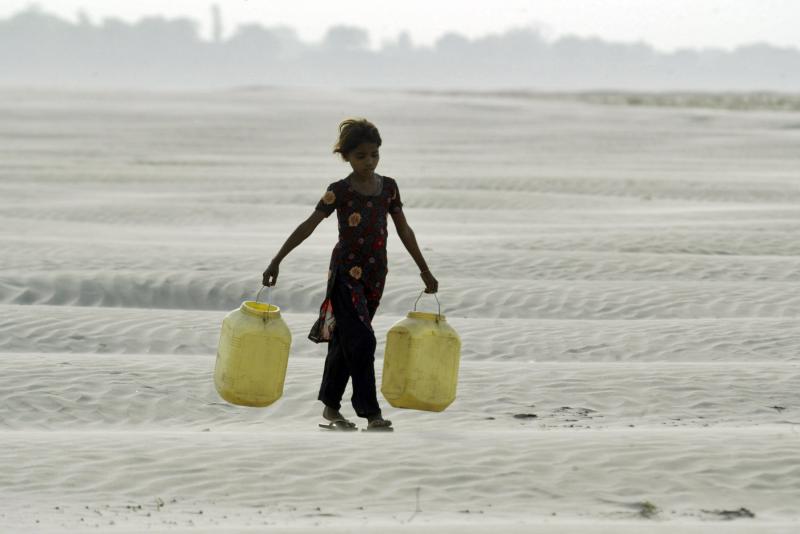
Drinking water: Piped drinking water being available to the households is one of the critical components for achieving universal access to safe drinking water in the country. Approximately 95% of the households in Goa and 86% of the households in Sikkim have access to piped water supply, with the states’ overall average being 42%.
The distance travelled to access the principal source of drinking water measures the quantity and quality of water used by the households. Off-premises improved water sources located within 30 minutes of the point of use are considered a basic service. If the source is located above 30 minutes from the source, level of service is classified as “limited” (WHO & UNICEF 2017).
Figure 4: Percent of Households with Piped Water Supply Connections into Dwelling or Yard Across States in India.
Source: Access (In)Equality Report 2021
Figure 5: Percent of Households with Distance to Primary Source of Drinking Water being within Dwelling Or within Premises Across States in India.
Source: Access (In)Equality Report 2021
The relation between the quantity of water used by the household and the time taken to fetch it can be qualitatively described as non-linear with a steep decline (at roughly 3 minutes of collection time) in water used once the source is not on the premise. While only 67% of the households in Indian states have access to water within the premise, more than 80% of households in Goa, Punjab, Haryana, Kerala and Sikkim have to travel less to access drinking water.
Sanitation: Access to toilets and availability of water in the toilets has been the agenda of the national sanitation programme “Swachh Bharat Mission” launched in 2014.
The inadequate access to toilets has caused India an economic loss of $53.8 billion — equivalent to 6.4% of the GDP as a result of health-related impacts including premature deaths, the cost of treating disease and productive time lost due to illness. Other causes include the impact of women not going to work due to related illnesses and of girls missing school.
Figure 6: Percent of Households with Access to Latrines Across States in India.
Source: Access (In)Equality Report 2021
Figure 7: Percent of Households with Access to Water in Latrines Across States in India.
Source: Access (In)Equality Report 2021
The findings from the index suggest that 100% of the households in Sikkim have access to toilets and 99% of households have access to water in the toilets, with the average of the top five front runner states being 97% and 98%, respectively.
Housing: Good quality, secure housing is one of the major end goals for many societies aiming to ease global poverty and ensure the provision of basic amenities for economically backward groups. Over the years, several governments, both state and central, have introduced various housing schemes in India. The Indira Awaas Yojana which began in 1996 was one of the first major housing schemes with large-scale goals. Renamed the Pradhan Mantri Awas Yojana Gramin, the scheme now works on the objective of housing for all by 2022. Until now, only 78% of the states in Indian have access to a pucca house.
Figure 8: Percent Households living in Houses under Good Condition Across States in India.
Source: Access (In)Equality Report 2021
Figure 9: Percent Households living in Pucca Houses Across States in India.
Source: Access (In)Equality Report 2021
On an average 95% of the top five front runner states have access to a pucca house, but the access to good condition houses in these five states is also abysmally low at 59%, though above the national average of 46%. The rural-urban disparities seen in the percentage of households with pucca houses and those in ‘good condition’ presents a grim picture.
Clean energy: For over three decades, successive central and state governments in India have made efforts to increase the penetration of clean cooking energy solutions like liquefied petroleum gas (LPG), improved biomass cookstoves (ICS), biogas plants and piped natural gas (PNG), among others. However, only 63% of the households in Indian states have access to clean fuel in India.
Figure 10: Percent Households with Clean Energy (Cooking Fuel) Across States in India.
Source: Access (In)Equality Report 2021
Nutrition: The index reveals that about 100% of the households in Kerala, Sikkim, Goa, West Bengal, Rajasthan, Manipur, Maharashtra, Gujarat, Himachal Pradesh, Arunachal Pradesh and Andhra Pradesh have access to food through PDS, while the states’ average being 98%.
Despite having the access, 189.2 million people are undernourished in India and about 51.4% of women in reproductive age between 15 to 49 years are anaemic. Even, the Global Hunger Index 2019 ranked India at 102 out of 117 countries on the basis of three leading indicators —prevalence of wasting and stunting in children under five years, under-5 child mortality rates, and the proportion of undernourished in the population.
Digital access: Measured by the number of internet users and mobile users in the country, digital access can also be considered one of the basic amenities, especially in light of the COVID-19 pandemic. Based on the survey conducted by IMRB in 2019, we find that on an average only 41% of the individuals in the Indian states are internet users, while 66% of the individuals are the main users of at least one mobile phone.
The internet users in Goa, Punjab, Kerala, Sikkim and Haryana make up 59%, 56%, 59%, 38% and 51% of the population, respectively. While the average amount of mobile users in the top five states is 68% of the population.
Jharkhand, Odisha, Tripura, Uttar Pradesh and Madhya Pradesh are the aspirants. Only 9% of the households in Jharkhand and 11.4% of the households in Odisha have access to drinking water. The access to water in latrines in these five states is below the average of all the states. Less than 30% of the households in these five states have access to “good condition” housing and on an average only 41% have access to clean fuel in these five laggard states.
Let’s take a step further and see the sociological and spatial dimensions of this ‘access inequality’ to basic amenities.
Measuring across social and rural-urban divides
It is well documented how marginalised (caste) groups such as Scheduled Castes (SCs), Scheduled Tribes (STs) and Other Backward Classes (OBCs) are not allowed to access the ‘same water’ sources via wells or community stand-posts as against the dominant caste groups in some rural villages in India (see Joshi & Fawcett, 2005 for more). This discriminatory access barrier is rooted in orthodox social beliefs which creates a barrier to access basic amenities, not only for water, but also other basic amenities: like community toilets, decent housing, etc.
Figure 11: Spatial Disparities On Access to Basic Amenities: The Rural-Urban Divide.
Source: Access (In)Equality Report 2021
On spatial considerations, where people reside have a strong impact on their opportunities, including access to basic amenities, healthcare, education, decent work. Based on population projections of Ministry of Health and Family Welfare (MoHFW), around 65.8% of the Indian population resided in rural areas in 2020, thus, a majority of India still lives in its villages. In aggregate, access to opportunities and resources have a clear spatial and social identity-based dimension: people of lower caste living in rural areas are far worse off than upper class/caste identity-based groups residing in urban populations (as shown in Figure 11 above).
Therefore, the results shown here by AEI on access to basic amenities, and in relative comparison — and expansion — to the scope of the GHI reflect how ‘insecurities’ stemming from a (dis)proportionate degree of access to basic amenities, including nutrition, varies from one state to another.
Yes, states with better governance, more focused welfare vision (centred around a state-vision of providing universal access to basic amenities for all groups), and better implementation with compliance mechanisms for existing Union/state-level programmes, do well.
However, deep-rooted access inequities exist due to sociological and gendered reasons, which do merit qualitative, ethnographic level interventions -for reasons of both analytical study and policy interventions.
While the national government of the day — including state governments — may do well to acknowledge the state of ‘Bharat’ we live in, rejecting ‘alarmist’ findings from an index, or calling its methodology “unscientific”, projects an amateurish and indifferent approach to resolving our problems.
(Deepanshu Mohan is associate professor of Economics and director at the Centre for New Economics Studies, Jindal School of Liberal Arts and Humanities, O.P. Jindal Global University. The author would also like to thank and acknowledge the work of the Access (In)Equality Index report’s co-authors: Richa Sekhani, Latika Sharma, Vanshika Mittal and Advaita Singh for making this analytical study possible. Article courtesy: The Wire.)


