
Recently, the Federal Reserve of the USA released a new data series called the Distributive Financial Accounts, which provide quarterly estimates of the distribution of wealth in America. The series goes back to 1989, and runs to the fourth quarter of 2018.
The insights of this new data series are many, but for this post here I want to highlight a single eye-popping statistic.
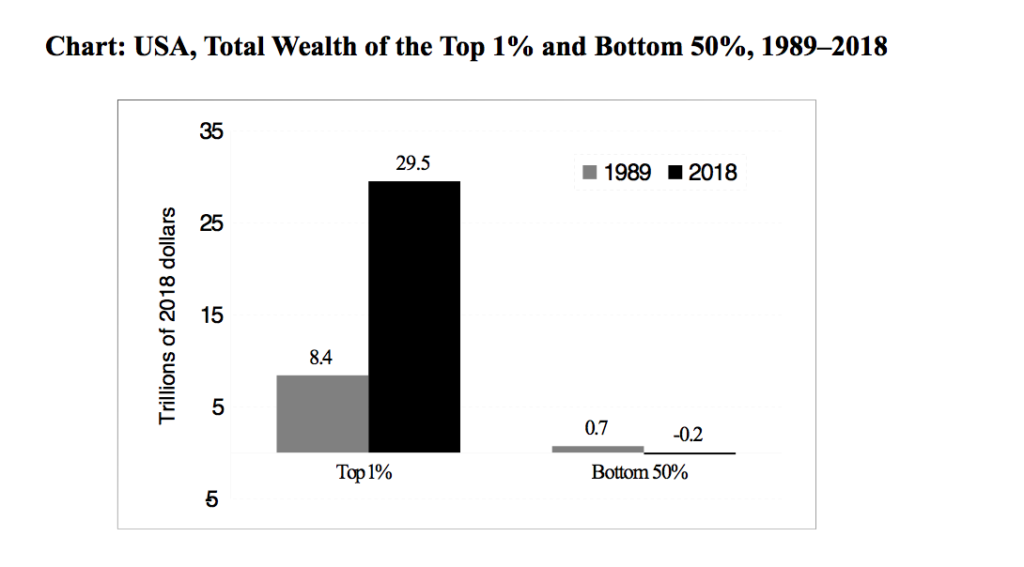
In 2018, whereas the top 1 percent owned nearly $30 trillion of assets, the bottom half owned less than nothing, meaning they have more debts than they have assets. This is a result of the economic policies followed in the US for the past 30 years, becauses of which the top 1 percent massively grew their net worth while the bottom half saw a slight decline in its net worth. Between 1989 and 2018, the top 1 percent increased its total net worth by $21 trillion. The bottom 50 percent actually saw its net worth decrease by $900 billion over the same period.
(Matt Bruenig is an American lawyer, blogger and policy analyst and founder of the People’s Policy Project, a crowdfunded think tank that focuses on socialist and social democratic economic ideas.)