The Struggle for Social Representation in Education and Employment
T.K. Rajalakshmi
When Rahul Gandhi pointed out that there were just three OBC (Other Backward Classes) officers among 90 secretaries in the Central government, he was pointing to the generic lack of representation of marginalised social groups in the top echelons of government. But he was not saying anything new. Although the number of people from historically marginalised social groups in education and employment has increased, the social effects of this have been nullified by the increasing privatisation of education and employment.
The All India Survey on Higher Education (AISHE) 2020-21, which the Education Ministry released on January 29, reaffirmed trends that have been prominent in the last two decades: a rise in the gross enrolment ratio (GER) for all social groups and a more representative higher education enrolment pattern.
The GER stood at 27.3 per cent, up from 8.1 in 2000-01 and 20.8 in 2011-12. The female GER overtook the male GER in 2017-18 and has remained higher since. The GER for Scheduled Castes and Scheduled Tribes, at 23.1 and 18.9 per cent, while lower than the overall GER was considerably higher than two decades ago. Students from the OBC communities accounted for 35.8 per cent of the 41.4 million students who enrolled for higher education, up from 31.2 per cent in 2012-13.
Not the whole story
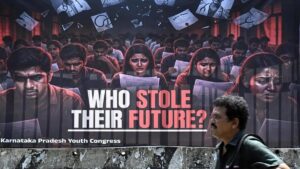
There is, however, another side to this story that is symptomatic of a larger social phenomenon: the growing contradiction between aspirations and opportunities. While the enrolment trend is indicative of the aspirations of all social groups to access education, the lack of public investment in education and the concomitant expansion of the private sector in education will have the effect of curtailing opportunities for the less privileged sections.
The AISHE report shows that 65 per cent of colleges in India are now private, unaided ones while only 21.4 per cent are government colleges. In fact, government colleges account for less than 35 per cent of total college enrolment. Even with universities, the number of private universities is increasing and so is the number of students enrolling in them.
However, if the total enrolment in higher education in the 2005-06 to 2010-11 period showed an increase of 13.2 million, this fell dramatically to 6.8 million between 2015-16 and 2020-21. The slowing down can be attributed to the absence of an expansion in public institutions of higher education.
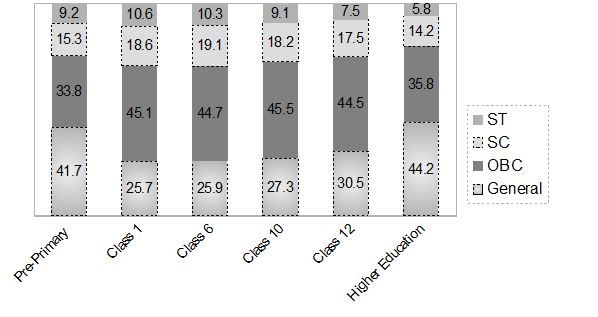
As far as the sector overall is concerned, the share of the SCs, STs, and OBCs has been relatively stable up to the secondary school level and shows a slight dip in the senior school level, only to decline sharply in the higher education level (see Table 1). In other words, there is still some distance to go before their representation in education matches their shares in the population.
Chart 1: Distribution of All India Enrolment in education at different levels by social group
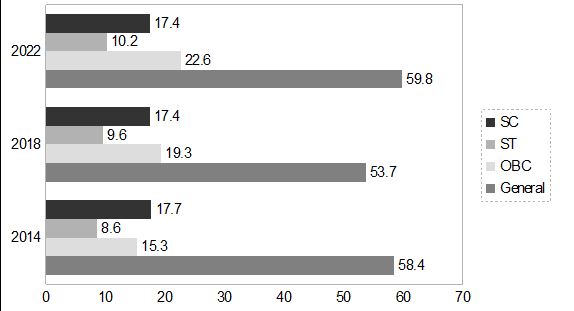
Access to higher education is seen as a route to jobs, especially government jobs. If we consider employment in all Central government services, for example, while the representation of SCs and STs is above the prescribed reservation percentages, that of OBCs—introduced in 1993—continues to be lower, but is increasing (see Table 2).
The improved percentage of OBCs is accompanied by a sharp reduction in the absolute number of employees, and this is true of the SCs and STs too , because of the overall decline in the number of employees in Central government services. As reported in Union Budget documents, the number of employees in Central government establishments has fallen from 33.38 lakh in 2014 to 31.69 lakh in 2022.
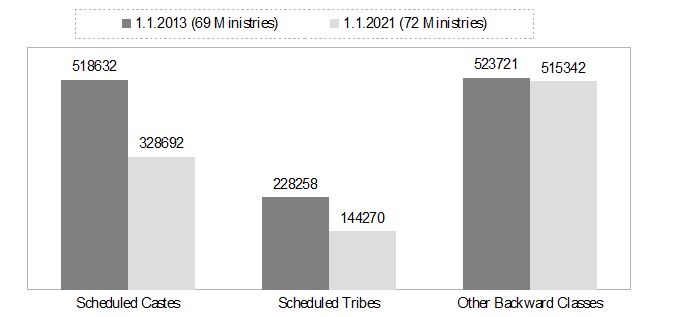
Chart 2: Representation of SCs, STs, and OBCs in the CPSEs
When disaggregated, the representation in Central government services looks less rosy: it is below the prescribed reservation percentages for all three groups in Group A services. In Group C services, their representation is much higher, and in the safai karamcharis component, the SC category employees account for 32.6 per cent of the total, disproportionately higher than the quantum of reservation applicable to them. The bulk of Group C employees is, therefore, dominated by OBC and SC categories.
It is the same story in Central Public Sector Enterprises (CPSEs). Data from the Public Enterprises Survey show that over five lakh jobs were eliminated between 2014 and 2022 in CPSEs. As a result, the number of SC, ST, and OBC employees also declined (see Table 3). Similarly, public sector banks saw a fall in the number of employees, from 8.86 lakh (nearly 73 per cent of all bank employees) in 2012-13 to 7.57 lakh (less than 43 per cent of all bank employees) in 2022-23.
Chart 3: Representation of Scheduled Castes, Scheduled Tribes, and Other Backward classes in Central Government services
While representation of the different categories in public employment might have improved—as it must with implementation of reservation—the declining significance of public sector employment itself means that overall representation is adversely affected.
In higher education, on the other hand, when compared with student enrolment, the teaching and non-teaching staff continue to be much less socially representative in character. Of the 15,51,070 teachers in 2020-21 enumerated by the AISHE, 56.2 per cent belonged to the general category, 32.2 per cent were OBCs, while SCs and STs were only 9.1 and 2.5 per cent. Among non-teaching staff, the situation was not very different, with 56.5 per cent from the general category, 24.7 per cent from the OBCs, and SCs and STs at 14.4 and 4.4 per cent. With higher education becoming increasingly privatised, a significant improvement appears unlikely in the foreseeable future.
Increasing quotas without redress of structural inequities is a zero-sum game. The 2011 (partly released) findings of the Socio Economic Caste Census were revelatory enough. An assessment of rural household income showed that marginalised groups had larger proportions of their populations in the lowest income categories and very few in the highest income groups.
The 2019 All India Debt and Investment Survey (NSS 77th round) showed that the average value of rural household assets was Rs.8,84,000 among STs, Rs.8,79,000 among SCs, Rs.16,45,000 among OBCs, and Rs.26,03,000 in the general (others) category.
Asset and land ownership
The 2018-19 Situation Assessment of Agricultural Households of Land and Livestock Holdings in Rural India (NSS Report 587), released in 2021, showed that while SCs made up 21.7 per cent of all rural households, they comprised only 16 per cent of agricultural households and owned only 9.5 per cent of the land held by all agricultural households. The OBCs made up 45.8 per cent of agricultural households and their share in land ownership was 47.8 per cent, whereas ‘“others” (general) comprised 23.9 per cent of agricultural households and owned 28.7 per cent of land. Among non-agricultural households, the SCs were 28.4 per cent, the OBCs 42.8 per cent, and others 18.8 per cent.
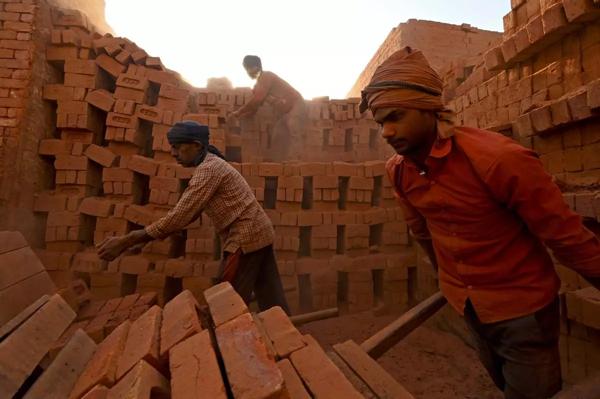
The asset and land ownership pattern also indicates that social groups like the SCs depend more on irregular wage employment. According to the Periodic Labour Force Survey (PLFS) data, 38.3 per cent of SC workers are in casual employment compared with 12.2 per cent among others. On the other hand, just 12.7 per cent of STs and 18.8 per cent of SCs are in regular wage/salaried employment compared with 29.8 per cent in the case of others.
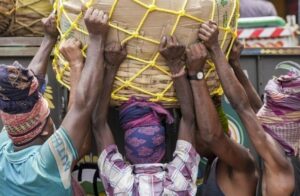
Manohar, Geeta, and Om Prakash are representative of the working-class population in western Uttar Pradesh. Manohar is an SC (Valmiki) and is employed as a driver. He says his daughter is the only one in his village in Gadh Ganga who has studied beyond class VI. “Had I not decided to move out, she would have not reached so far,” he says. He does part-time jobs of safai (cleaning) in a sales tax office to meet school fees, tuition, and house rent expenses. His wife cleans up in a beauty parlour. Manohar’s father was a constable. After his death, only one of Manohar’s four brothers could be absorbed into the police on compassionate grounds. The other three, like Manohar, have no stable source of income.
Geeta is a Kushwaha, an OBC, and works as a cook. She does not know about OBC reservation, her sons have not seen a university, but she hopes her grandchildren will complete school. Om Prakash, also an OBC, works as a gardener. He is unhappy with his income but says he knows little other than gardening. His son, however, managed to finish school and does part-time jobs to supplement the family income.
Reservation in the private sector
Reservation for SC, ST, and OBC communities in education and public employment has made a modicum of social and economic mobility possible. However, these prospects are now being increasingly thwarted by the secular decrease in the creation of new government jobs and the increasing trend of contractual work. The largest proportion of the shrinking job opportunities is precarious in nature and is available in the private sector, but the private sector’s share in the small number of higher salary jobs has also increased. This is the background to the demand for reservation in the private sector and within religions.
While the effect of the Bihar caste survey in pushing the debate on reservation and representation to the next level will only be known at a later date, the findings themselves will mean little unless they trigger a concomitant push for more opportunities of secure employment for these communities.
(The author is Senior Deputy Editor of Frontline magazine. Article courtesy: Frontline magazine.)