
❈ ❈ ❈
Ignore the Spin, Incomes, Consumption and Private Investment Have Stagnated
M.K. Venu
Finance Minister Nirmala Sitharaman’s shortest budget speech (56 minutes) was largely about reiterating the Modi government’s achievements over the past decade. It is another matter that many of the key achievements cited did not have the backing of data or facts. But facts have never come in the way of Prime Minister Modi’s penchant for weaving self-congratulatory narratives.
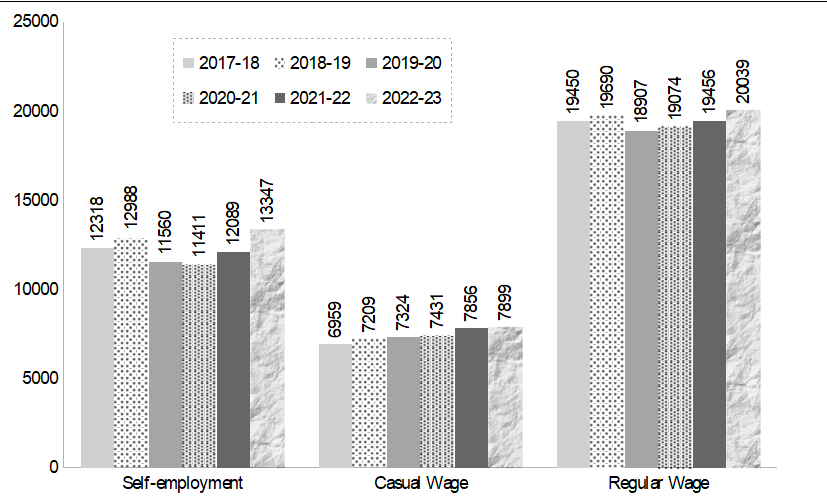
The most astounding claim the finance minister made was that average real incomes have gone up by 50% during Modi’s tenure. This flies in the face of the government’s own data sets formally released some time ago stating that regular average monthly wages in India have stagnated at around Rs 20,000 for five years. It was Rs 19,450 in 2017-18 and Rs 20,039 in 2022-23, as per the recently released Periodic Labour Force Survey (PLFS). Real wages have actually declined by over 25% in five years. Given this data released by the Modi government, it is astonishing that the finance minister should make a claim of 50% growth in real incomes.
There is near consensus among economists, including among those well disposed towards the Modi regime, that real rural wages have stagnated for years. This income stagnation has reflected in the stagnation in private consumption over the past several years. Private consumption, the main driver of GDP growth in India, has grown at about 3% on average annually in the past five years. This data, too, is corroborated by the Ministry of Statistics and Programme Implementation.
So broadly, there is evidence of stagnation in income and consumption. There is also consensus within the industry that private investment has stagnated through Modi’s 10-year tenure. The finance minister herself has been exhorting domestic industry to start investing in fresh capacity.
So incomes, consumption and private investment have broadly stagnated. There has also been a sharp fall in household savings in recent years as real incomes have declined. These facts cannot be controverted even by whatever limited data is coming out of the department of statistics. It is possible that in future even these data sets may cease to exist! The average GDP growth under the Modi government’s tenure so far is 5.8% and many economists, including Arvind Subramanian, the Chief Economic Advisor in NDA I, have suggested the number could be up to 2 percentage points less.
Recently, Dr Pronab Sen, chairperson of the Standing Committee on Statistics, told me that the K-shaped growth recovery after COVID-19 has possibly resulted in a big statistical anomaly. In normal times, organised sector growth has a positive correlation with the vast unorganised/informal sector. Both grow together. But for the first time after COVID-19, the organised sector has shown a rebound but the unorganised sector continued to suffer. The positive correlation broke down. This leads Sen to conclude that the GDP growth number could be overestimated because in the Indian system, the organised sector data available with the corporate affairs ministry is used to extrapolate for growth in the vast unorganised segment.
So, the GDP number has also been suspect for a long time. Most budget numbers are predicated on the nominal GDP stock. If the GDP number is flawed, many other related figures and ratios will also be faulty.
Of course, all this does not come in the way of finance minister Sitharaman making hyperbolic claims of India being the biggest growth story in the world with rising incomes, consumption, investment and employment. The PLFS survey also shows a huge growth in the number of self-employed – from 52% of the total employed in 2017-18 to 58% in 2022-23.
Labour economist Santosh Mehrotra reckons the growing army of self-employed constitutes very low quality employment and among them the number of unpaid workers has increased from 40 million in 2017-18 to 95 million in 2022-23. Unpaid workers are not treated as formally employed by the International Labour Organisation. No wonder the finance minister’s speech hardly devoted even a paragraph on employment strategy.
This is the nature of the political economy that Prime Minister Modi has created before seeking his third term as a “development messiah”. Privately, he probably recognises the distress among the bottom 60% of the population and has, therefore, chosen to provide free food to them for the next five years.
When Modi took power in 2014, his slogan was to move India’s poor from dole and entitlement to a framework of empowerment and partnership in growth. That objective clearly lies in tatters, notwithstanding a booming stock market in which a few hundred companies’ shares are watched with bated breath by less than 7% of the population.
(Courtesy: The Wire.)
❈ ❈ ❈
The K is Indian GDP’s Reality: Why Deny?
Arun Kumar
The K-shaped pattern of growth within the Gross Domestic Product (GDP) pointed to by critics has riled officialdom and its supporters because it implies not only growing inequality but an overestimation of GDP and its growth.
The supporters deny any possibility of a dichotomous K-shaped growth pattern on the basis of data on income tax returns, labour force participation, consumption, etc. In doing so, they commit a methodological error.
Types of inequality
There are three different kinds of inequalities in an economy— wealth, income and consumption. The government supporters mix them up. There is a hierarchy between them with wealth inequality greater than income inequality greater than consumption inequality.
The reason for this ranking is that everyone has to consume a basic minimum to survive. The poor consume almost their entire income and hardly save. Often they borrow to consume so that their consumption is larger than their income. People at higher income levels save. The higher the income bracket, the more the savings.
So, as one goes to higher and higher income brackets, consumption becomes a smaller and smaller fraction of the income. So, the ratio of consumption to income falls with income. That is why income disparity is greater than the consumption disparity.
Further, the savings are invested and become part of one’s wealth. The higher the income, the more the savings and the accumulation of wealth. The poor have almost no savings and may be in debt, that is, they have negative wealth.
Thus, the wealth curve rises even more steeply than the income curve. The wealth of the wealthy yields an additional income and that leads to more inequality.
These theoretical aspects need to be kept in mind in the debate on inequality. A bare perusal of the arguments of the supporters of the official line shows a mix-up of these three kinds of inequality. What does the actual available data reveal?
Factors underlying growing inequality
First, the GDP data has huge errors since it does not independently account for the contribution of the non-agriculture unorganised sector. This component of GDP has been declining since demonetisation when it was hit hard and hardly recovered from this blow.
However, this decline is not officially measured since it is proxied by the growing organised sector. This gives an upward bias to the GDP and incomes of the marginalised sections, resulting in the false claim that inequality is declining.
Second, the growth in the organised sector is at the expense of the unorganised sector and that is the K to which critics point. This is visible in various industries.
For instance, e-commerce (in the organised sector) is growing at the expense of the unorganised sector trade. Similar reports are available from other industries such as fast-moving consumer goods (FMCG), leather goods, luggage and pressure cookers.
This applies to most of the industries where an item is produced both in the unorganised and organised sectors. Reserve Bank of India (RBI) data shows rapid growth in the sales of the corporate sector when the economy is mostly stagnant.
That can only imply the growth of this sector at the expense of the other component— the unorganised sector.
Third, taxes are paid mostly by the organised sector and the well-off. The unorganised sector is exempt the Goods and Services Tax (GST). For a turnover of below ₹50 lakh, there is no GST and for turnover up to ₹1.5 crore, tax rate is 1 percent under the composition scheme. Former Union finance minister, late Arun Jaitley, used to say, 5 percent of the units pay 95 percent of the GST.
Corporation tax is mostly paid by the big companies. Income tax is paid mostly by the well-off. Out of around eight crore tax returns filed by individuals, effective tax is paid by only 1.5 crore of a population of 141 crore. That is 1.1 percent population.
So, even if income tax data shows a reduction in disparity, that is only from the return filers, who constitute 5.5 percent of the population. That cannot tell us about inequality in the entire population. For example, 30 crore unorganised sector workers are registered on the e-shram portal. Around 94 percent of them report an income of below ₹10,000 per month, way below the taxable limit.
High tax buoyancy of GST, corporation tax and income tax only reflects the rapid growth of the organised sector. In a stagnant economy, this growth is at the cost of the unorganised sector and that increases disparity.
Further, it is the well-off who generate black money by hiding their incomes. In other words, their incomes are actually higher so inequality is greater.
Fourth, due to inflation, incomes rise but their real value may fall if the rate of inflation is higher. Further, as people earn more they go to a higher tax slab and pay more tax. This is called ‘bracket creep’.
So, increased tax payment does not necessarily mean an increase in people’s real income. That is why the level at which individuals begin to pay tax has been raised from ₹2.5 lakh to ₹5 lakh and now to ₹7.5 lakh.
Fifth, there is an increased production of FMCG in the organised sector but not necessarily of consumption. The market share of the big FMCG companies has increased at the expense of smaller units.
So, organised sector units are producing more and because this is at the expense of unorganised sector units, overall production is not rising. Since the well-off are consuming more, especially premium products, it is people in the lower income brackets who have cut consumption. Thus, FMCG consumption is not an indication of a decline in disparities.
Sixth, Periodic Labout Force Survey (PLFS) data shows an increase in employment in the rural sector. This is mostly distress employment. The poor are too poor to be able to afford not to work.
So they do residual work such as pulling a rickshaw, doing head-load work and selling peanuts on the roadside. This is self-employment and not work generated by the system. It yields low incomes and aggravates disparities.
Further, many workers lost work during demonetisation and lockdown and had to depend on the Mahatma Gandhi National Rural Employment Guarantee Act, 2005 (MGNREGA) at wages below what they were earning earlier. This again leads to a growth of disparities.
Seventh, the government giving free ration or gas to the poor increases consumption but not income. So income poverty persists even if consumption rises. Giving 5 kg of foodgrains free to 81 crore Indians is itself an admission that income poverty persists.
Finally, while money wages have risen due to inflation, they mostly lag inflation so that real incomes have fallen. So, who is getting the benefit of an increase in national income— the businesses?
RBI data shows corporate profits have soared. That is why the stock markets have reached new heights. Hence the incomes at the upper rung of the income ladder have risen and so has inequality. This should not be confused with the increase in the wealth of the well-off due to the rise in the valuation of stocks.
Conclusion
All the arguments used by supporters of the government to show a decline in inequality and, therefore, an absence of a K-shaped growth pattern, when carefully analysed, prove that indeed a K-shaped pattern of growth exists.
Their argument is based on the denial of the decline of the unorganised sector and the growth of the organised sector at its expense. Since the data is almost entirely based on the organised sector, it masks the K-shaped pattern of growth.
There are also other forms of inequality— gender, regional, between agriculture and non-agriculture, capital and labour and caste inequality.
In addition to K, what else will the officialdom deny?
(Arun Kumar is a Retired Professor of Economics at the Jawaharlal Nehru University. Courtesy: Newsclick.)