In France just before the Revolution of 1789, the proportion of national wealth held by the top 10 percent was about 90 percent, and the fraction possessed by the top 1 percent was as much as 60 percent. [1] After the Revolution, the proportion held by the top 10 percent fell slightly due to the redistribution of land belonging to the aristocracy and clergy in favour of the bourgeoisie (a little over 9 percent).
Concerning the lion’s share possessed by the top 1 percent in 1789, Piketty underlines that the denunciation of the 1 percent by Occupy Wall Street combined with the proclamation “We are the 99 percent” is somewhat reminiscent of the famous pamphlet “Qu’est-ce que le tiers état?” (“What is the Third Estate”) published in January 1789 by Abbot Sieyès. [2]
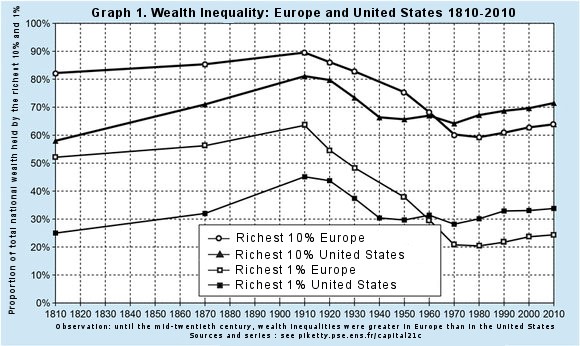
Piketty has created a graph showing the evolution of the share possessed by the richest 10 percent and 1 percent between 1810 and 2010. He groups together the principal European countries in the category “Europe,” and presents the United States separately.
In Europe, the proportion of national wealth owned by the top 10 percent was equivalent to more than 80 percent in 1810, and rose during the 19th century and early 20th century, reaching 90 percent in 1910. It then started to fall because of World War I and the concessions that the bourgeoisie were obliged to make in the face of the class struggles that followed 1914-1918. [3] The decrease continued after World War II for the same reasons and the share possessed by the top 10 percent reached its lowest point in 1975 (slightly less than 60 percent). After that, it started to rise again, reaching nearly 65 percent in 2010. The share of the top 1 percent followed the same general trend, going from a little over 50 percent in 1810 to just over 60 percent in 1910. It started to fall in 1910, and reached its lowest point in 1970-1975 (20 percent) then started to go up again. In the United States, the evolution followed the same chronological pattern, but it is important to underline that whereas the share possessed by the richest 1 percent and 10 percent was less than that of their European counterparts in the 19th century, this situation changed as of the 1960s: today their slice of the cake is now greater than that of their European counterparts.
There are two obvious conclusions: 1. The trend is toward greater inequality, with a significant increase in the wealth owned by the richest 1 percent and 10 percent; 2. The evolution of wealth distribution can be rigorously explained by the evolution of social struggles and power relations between different classes.
Piketty sums up the reasons that led to the reduction in the proportion of wealth possessed by the richest groups between World War I and 1970, and those that subsequently caused it to rise again: “Briefly, the shocks that buffeted the economy of the period 1914-1945 – World War I, the Bolshevik revolution of 1917, the Great Depression, World War II and the consequent advent of new regulatory and tax policies along with controls on capital – reduced capital’s share of income to historically low levels in the 1950s.Very soon, however, capital began to reconstitute itself. The growth of capital’s share accelerated with the victories of Margaret Thatcher in Britain in 1979 and Ronald Reagan in the United States in 1980, marking the beginning of a conservative revolution. Then came the collapse of the soviet bloc in 1989, followed by financial globalization and deregulation in the 1990s. All of these events marked a political turn in the opposite direction from that observed in the first half of the twentieth century. By 2010, and despite the crisis that began in 2007-2008, capital was prospering as it had not done since 1913.” [4]
It is clear that the world wars produced both profound popular resentment against the capitalist class, and were followed by major social struggles, which in several countries took the form of revolutionary crises. The 1929 financial crisis also resulted in radicalization and significant social struggles (particularly in the United States). Those in power had to make concessions to popular demands. We shall see below, for example, the actions that were taken by the governments of the main countries after World War I and II with regard to taxation, influencing to various degrees the proportion of wealth and income appropriated by the richest 1 percent. We then observe, as from the offensive triggered by the capitalist class against the working classes during the 1970s and 1980s, [5] a radical change in the policies of those governments, particularly with regard to taxation.
To measure the evolution of wealth, [6] Piketty compares it to national income [7] “At the start of the 1970s, the total value of private wealth – net of debt – was between two and three-and-a-half years’ worth of national income in all rich countries, on all continents. Forty years later, at the start of the 2010s, private wealth represents between four and seven years of national income, [8] again in all the countries studied. There can be no doubt about the general trend: aside from the financial bubbles, we have witnessed the large-scale return of private capital in rich countries since the 1970s, or rather the emergence of a new form of wealth-based capitalism.” [9]
We can also observe that public wealth has considerably decreased in the last 40 years, after increasing in several countries, particularly after World War II. In France, the government nationalized the Bank of France in 1945 together with the four largest deposit banks, the Crédit Lyonnais, Société Générale, National Bank for Trade and Industry, and Comptoir national d’escompte de Paris. Louis Renault, head of the Renault car company, was arrested in September 1944 for his collaboration under the Nazi occupation, and the company was nationalized in January 1945. [10] The British government nationalized the Bank of England in 1946. According to Piketty, in the industrial and financial sectors, in France, “the state’s share of national wealth exceeded 50 percent from 1950 to 1980.” [11]
As Piketty also writes, we can observe: “first, the gradual privatization and transfer of public wealth into private hands in the 1970s and 1980s, and second, a long-term catch-up phenomenon affecting real estate and stock market prices, which also accelerated in the 1980s and 1990s, in a political context that was globally very favorable to private wealth than that of the immediate post-war decades.” [12] This second phenomenon is clearly connected with the financialization of the economy.
Footnotes
[1] p. 544.
[2] “What is the Third Estate? Everything. What has it been until now in the political order? Nothing. What does it desire to be? Something.”
[3] The graph uses time steps of one decade in order to reveal the evolution as clearly as possible. Had it used time steps of one year, it would certainly have shown an increase in the wealth of the richest groups during the late 1920s.
[4] Pp. 34-35.
[5] I have made an analytical summary of the shift that took place in the late 1970s and early 1980s at international level, particularly in the article “In the South as well as the North: from the Great Transformation in the 1980s to the current crisis”, https://cadtm.org/In-the-South-as-well-as-the-North, 1 October 2009, and in the book A Glance in the Rearview Mirror: Neoliberal Ideology from its Origins to Today, Haymarket, Chicago, 2012.
[6] National Wealth (or National Capital as Piketty also calls it, which is a source of confusion, see Appendix 1. Valuable research despite some basic shortcomings) is the “sum total of non-financial assets (housing, land, business assets, buildings, machines, equipment, patents, and other directly held professional assets) and financial assets (bank accounts, savings plans, bonds, shares and other company stock, financial investments of any kind, life insurance contracts, pension funds, etc.), minus liabilities (i.e., net of all debt). If we limit ourselves to the assets and liabilities held by private individuals, we obtain the private wealth or private capital. If we consider the assets and liabilities held by the State and civil services (local authorities, social security organisations, etc.), we obtain the public wealth or public capital.” Chapter 1.
[7] Piketty explains how national income is calculated: subtract from the gross domestic product (GDP) the annual depreciation of capital then add the net income earned abroad (or take away the net payment made abroad if that exceeds income). See Chapter 1.
[8] Piketty also specifies that if the wealth calculation took into account financial liabilities and assets, the thus inflated wealth would represent 10 to 15 times national income, 20 times in the case of the UK. He reminds us that from the 19th century to the early 1970s, wealth corresponded to from 4 to 5 years of national income. If derivatives were taken into account, the factors would be even much higher.
[9] Chapter 5., p. 125
[10] Chapter 3, p. 100.
[11] Chapter 3, p. 100.
[12] Chapter 5, p. 125.
(Article courtesy: Committee for the Abolition of Illegitimate Debt, Belgium.)


