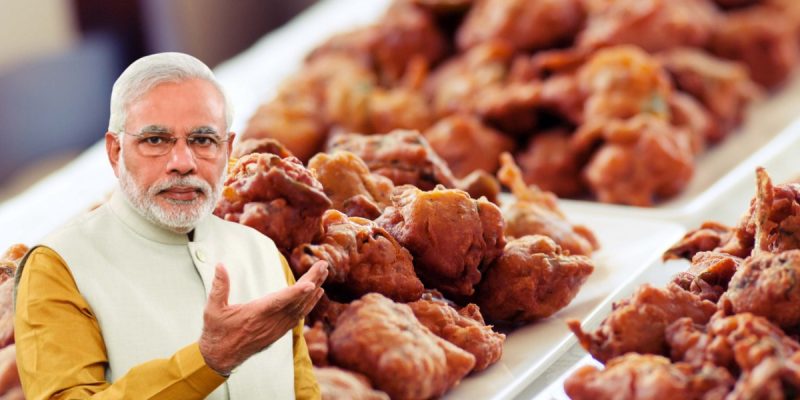
In response to a question about India’s job crisis back in 2018, Prime Minister Narendra Modi asked his interviewer: “If someone opens a pakoda shop in front of your office, does that not count at employment? The person’s daily earning of Rs 200 will never come into any books or accounts. The truth is massive people are being employed.”
The prime minister believes that earning Rs 6,000 a month (200 x 30) for a family of five should suffice. If we project the official poverty line of India to 2019-20, that poverty line income for a family of five would be Rs 7,340; that would still mean ‘selling pakodas’ yields earnings 18% below the urban poverty line income, and even less than the lower rural poverty line (monthly spending).
We present poverty data based on the government’s own measure of per capita consumption expenditure. India has not released consumption expenditure survey (CES) data since 2011-12, although the National Survey Organisation (NSO) conducts these survey every five years. The CES of 2017-18 (already conducted a year late) was not made public by the Government of India.
India’s periodic labour force surveys (PLFS), including the five-yearly Employment-Unemployment Rounds from 1973-4 to 2011-12 (also by NSO) have also collected consumption expenditure of households. The PLFS has maintained that tradition, but is now conducted annually by NSO. While the PLFS questions on consumption expenditure are not as detailed as those of CES, they are sufficient to estimate changes in consumption on a consistent basis across time. We estimate the incidence of poverty (i.e. the share in the total population below the poverty line), as well as the total number of persons below the poverty line. This is the same official poverty line estimated by the Planning Commission in 2012, but we update that poverty line to 2020, adjusting for inflation. We also made adjusted estimates to ensure that the less detailed consumption spending information in PLFS as compared to the CES is taken into account.
From 1973 to 2012, the incidence of poverty was falling. In fact, since India started collecting consistent estimates of poverty (1973), the incidence of poverty has always fallen. It was 54.9% in 1973-4; 44.5% in 1983-4; 36% in 1993-4 and 27.5% in 2004-5. The estimates were based on the Lakdawala poverty line, named after a distinguished economist, then a member of the Planning Commission. In 2011, this national poverty line was revised upwards, in accordance with recommendations of an expert group chaired by late Suresh Tendulkar (then professor, Delhi School of Economics).
Based on the Tendulkar poverty line, we have extended the 2011-12 poverty line for each state, and used the consumption expenditure reported by PLFS to generate a consistent estimate of poverty. NSO’s PLFS collects household monthly per capita consumption expenditure based on the Mixed Recall Period methodology. (Similar to the CES, the PLFS also asks the household questions about consumer durables for a 365 recall period, but for non-durable consumption goods/services its question expects a recall period of 30 days prior to survey.)
Since the majority of India’s population (certainly over 65%) is rural, poverty in India also is predominantly rural. Remarkably, by 2019-20 (till June 2020), poverty had increased significantly in both rural and urban areas in absolute terms. The important point is that this is consistent with the CES data for 2017-18 that was leaked data. The leaked data showed that rural consumption between 2012 and 2018 had fallen by 8%, while urban consumption had risen by barely 2%.
For the first time since the estimation of poverty began in India, the absolute number of poor has risen: from 217 million in 2012 to 283 million in 2019-20 in rural areas; and from 53 million to 63 million in urban areas. India’s poor have grown by 76 million (till June 2020) in a matter of eight years.
Figure 1: Absolute number of Poor (million) as per Tendulkar’s methodology

Source: Estimation based on NSSO’s CES, and PLFS data (adjusted for the EUS-CES differences).
Note: Poverty Line (Monthly per capita consumption exp: Official (Tendulkar) poverty line
| Sector | 2004-05 | 2011-12 | 2019-20 |
| Rural | Rs. 446.7 | Rs. 816 | Rs. 1217.9 |
| Urban | Rs. 578.8 | Rs. 1000 | Rs. 1467.6 |
Two facts stand out: between 1973 and 1993, the absolute number of poor had remained constant (at about 320 million poor, Lakdawala line), despite a significant increase in India’s total population. Between 1993 and 2004 the absolute number of poor fell by a marginal number (18 million) from 320 to 302 million, during a period when the GDP growth rate had picked up after the economic reforms. It is for the first time in India’s history since 1973 that there was an increase in the absolute numbers of the poor between 2011-12 and 2019-20.
The second fact is for the first time ever, between 2004-5 and 2011-12, the number of poor fell, by a staggering 137 million, or nearly 20 million per year. This was because of India’s ‘dream run’ of growth: over 2004 and 2014 the GDP growth rate had averaged 8% pa – a 10-year run never achieved before or since. Between 2015 and 2019 the GDP growth rate has fallen to below 6%, before the 2020 contraction. This is one reason for increasing poverty.
The second is the resulting rise in joblessness reflected through a massive rise in youth unemployment rate (6.1% to 15% during 2012-2020); and third is the fall in real wages for many sections.
In the workforce, under a quarter are regular wage workers; another quarter are casual wage workers; and remaining half are self-employed. In urban India, the real wage rate for regular salaried workers declined massively to Rs 186, in contrast to an increase from Rs 183 to Rs 226 during 2005-2012 when non-farm jobs grew. Similarly, the real wage rate of regular salaried workers in rural areas decreased from Rs 48 to Rs 41 during 2012-2020.
Although the real wages of casual daily wage labourers increased marginally during 2012-2020 in both rural (from Rs 22 to Rs 26) and urban (from Rs 87 to Rs 102), the real daily earnings of rural self-employed decreased from Rs 21.1 to Rs 19.9, and did not increase much in urban areas (a negligible rise from Rs 139.9 to Rs 141.3) during 2017-2020. Since the fall in wages and earnings are mostly concentrated at the lower end of wage and skills distribution, the number of poor increased.
The ‘pakoda’ employment (essentially self-employment or casual wage work) is consistent with the government’s position, often articulated by the prime minister, that India must generate job creators, not job seekers; ‘self-employment’ is the Indian way, and should be promoted as atmanirbharata. An opposition party had responded to the prime minister’s ‘pakoda as employment’: “if frying pakodas is classified as employment, begging should be included as well.”
(Santosh Mehrotra is Research Fellow, IZA Institute of Labour Economics, Bonn and Jajati Keshari Parida teaches economics at the Central University of Punjab. Courtesy: The Wire.)