Everything Wrong with NITI Aayog’s Claim of 24.8 Crore Emerging Out of Poverty in 9 Years
Santosh Mehrotra
According to a NITI Aayog discussion paper, multidimensional poverty in India declined from 29.17% in 2013-14 to 11.28% of the population in 2022-23, with about 24.82 crore people moving out of this bracket in nine years to 2022-23. They also claim that Uttar Pradesh, Bihar and Madhya Pradesh registered the largest decline.
The National Multidimensional Poverty Index or NMPI measures simultaneous deprivations across three equally weighted dimensions of health, education, and standard of living that are represented by 12 sustainable development goals-aligned indicators, according to NITI Aayog. These include three Health (nutrition, child and adolescent mortality, maternal health), two Education (years of schooling, school attendance), and seven Standard of Living indicators (cooking fuel, sanitation, drinking water, electricity, housing, assets, and bank accounts).
Thus, the NMPI by NITI Aayog has 12 indicators while global MPI covers 10 indicators. Are these claims believable?
The NITI Aayog is using data from the National Family Health Surveys or NFHS 3 for 2005-6. It has claimed that the NFHS 4 of 2015-16 applies from 2014 to 2016. Since there is no year-by-year data for the 12 indicators, just a straightforward compound annual growth rate projection is carried out by NITI, assuming that United Progressive Alliance period improvement rates between 2005-6 and 2015-16 in the 12 indicators applied to two years (2015 and 2016) of the NDA government’s term of office.
Is that credible? There is no prima facie reason for assuming that the 7.9% per annum GDP growth rate would deliver similar results to a period when the GDP growth rate for the recent 9 years fell to 5.7% per year.
As though that presumption was not incredible enough, the NITI Aayog paper goes further, drawing upon NFHS 5 data for 2019 and 2021 (please note, not 2019 to 2021 because the survey was stopped after data collection was stopped in 22 states due to COVID), to project beyond 2021 – to 2022 and 2023. In other words, yet another linear projection was made by the authors to extend their conclusions to two years beyond the end of COVID. In other words, it was using data for non-COVID years to extend non-COVID rates of improvement after COVID, to 2022 and 2023. Thus the question is legitimate as to whether that assumption is justified and credible or not.
Let us look at how COVID impacted on the 12 dimensions of NMPI, starting with Education – school attendance and years of schooling. In an evaluative frame of analysis, the log frame is used, where we use input (e.g. schools, teachers) to achieve a process (school attendance), which lead to outputs or outcomes. Both the education sub-indicators of NMPI are input or process indicators (not indicators of output or outcome). The substantive implication of this evaluative frame is that there is a logical connection between inputs, processes, outputs, and outcomes. Hence, during COVID children lost two years of school: so no attendance over two years, and that is likely to affect their learning not just in those two years, but also till later. The latter will likely adversely affect their years of schooling down the road.
However, that does not bother the analysts who decided to ignore the medium, and potentially long-term, impacts of COVID well into two post-COVID years.
A similar flawed logic is used in the NITI paper for the Health indicators. Mortality (an outcome) increased sharply during COVID. People’s health (a process in the log frame) deteriorated. So, a legitimate concern is: how can pre-COVID rates of improvement (or CAGR) in health status apply to the immediate post-COVID period, when COVID was primarily a health shock to the whole world? It adversely affected people’s health, not just immediately, but over the medium run.
The three health indicators (nutrition, child and adolescent mortality, maternal health) were all adversely impacted by COVID. People are still suffering the health impacts of the virus itself. All three health indicators of NMPI are outcome indicators (unlike the education sub-indicators of NMPI), and health outcomes turned very adverse. And yet, the authors of NITI’s NMPI have no qualms about ignoring the long term health impacts of the COVID shock to human health.
NITI has no qualms also about claiming that India’s poorest states (Uttar Pradesh, Bihar, Madhya Pradesh) had the best NPMI improvement, despite being the worst affected COVID states.
The NMPI’s Standard of Living indicators (cooking fuel, sanitation, drinking water, electricity, housing, assets, and bank accounts) are all input indicators. One could claim that the trend of improvements in the first five input indicators pre-COVID would have recovered in the post-COVID period to pre-COVID levels, despite disruptions to the programmes of implementation in each of these areas.
However, the fact remains that the government went into drastic fiscal consolidation mode even as COVID began in FY21 – India’s fiscal stimulus was among the weakest among emerging market economies (a max of 3% of GDP over FY21 and FY22), when central and state debt to GDP ratio rose to over 90% before falling to 81%, at present. Consolidation has continued, and spending is constrained: health spending was 1.3% of GDP (despite the intention expressed in the National Health Policy 2017 to take it to 2.5% of GDP by 2025 – just one year away.
The new National Education Policy 2020 sets the goal of 6% of GDP for public expenditure. Far from moving in that direction, education public expenditure to GDP has shrunk from 4% pre-2014 to 2.9% currently. None of this fiscal consolidation bodes well for any of the NMPI Standard of Living indicators. Public spending is what is the basis for expanding basic services on which depend most of NMPI indicators’ improvement. Yet, NITI Aayog is claiming these indicators would have improved post-COVID in FY22, and FY23.
Unfortunately, manufacturing evidence has been rather systematic in the last several years. In fact, the whole purpose of making NMPI the poverty indicator for India, while consumption expenditure surveys were not done for eight years from 2014 to 2022, is part of a political strategy. A paper by government economists (Bhalla, Virmani, Bhasin), purportedly an IMF Working Paper in 2021, claimed on the basis of a flawed methodology that consumption poverty in India has fallen to 1% of India’s population. However, no one in the world estimates consumption poverty in developing countries by using National Accounts Estimates of private consumption, rather than a consumption expenditure survey. That does not prevent government spokesmen at the highest levels to claim consumption poverty is down to 1% in the last 10 years.
The newest fabrication of a multidimensional poverty estimate by NITI Aayog is yet another effort to create a narrative in the run up to Lok Sabha elections 2024.
(Santosh Mehrotra is Visiting Prof of Development Economics, Centre for Development Studies, University of Bath, UK. Courtesy: The Wire.)
❈ ❈ ❈
In an article published in ‘The Wire’, titled ‘Niti Aayog ‘Poverty’ Stats: Serious Theoretical, Methodological, Empirical Questions’, Deepanshu Mohan writes (extract):
The NITI Aayog along with the UNDP released a discussion paper on the findings of their Multidimensional Poverty Index, attempting to study the decline of poverty rates and the number of multidimensionally poor people in India across various time periods.
There are serious theoretical, methodological, and empirical questions that remain yet to be settled on a subject that has severe policy, welfare, and state-ideological implications. Unfortunately, there is less of an intent or expressed willingness by the government, and those in NITI Aayog too, to engage with these issues.
Rather, what we see is a coercive push – unfortunately by different institutional ways and means – to keep beating down any possible data towards a rhetorical modelled reality painted by those who are obsessed with the view that ‘poverty reduction in India’ is a consequential reality/happening in the last ten years (under the Modi government).
Look closely…
But let’s look more closely at the Multidimensional Poverty Index created by NITI Aayog in alignment with the globally acclaimed Alkire Foster index methodology….
Given a paradoxical reflection of magical realism shaping much of the underlying data around growth and other developmental indicators and metrics on the Indian economy, and in particular terms to what we have seen in the quality (and politicisation) of India’s statistical infrastructure over the last 10 years, one may ask the question: Are these claims – as projected by the MPI findings, credible? …
Evidence for massive jump in poverty after COVID
As part of our InfoSphere edition on the Great Poverty Debate in India, we discussed earlier how the disproportionate impact of the pandemic and the pandemic-induced lockdowns (and other restrictions) affected poorer households and states.
An analysis of household income data analyzed by APU (State Of Working India 2021, Azim Premji University) revealed that the decline in incomes during the COVID-19 period was higher for lower-income percentiles and gradually decreased for higher percentiles.
The bottom 10 percentiles experienced a significant 27 percent drop in incomes, while the decline was 23% for the 40th to 50th percentiles and 22% for the top 10 percentiles. Furthermore, there was a 15-percentage point increase in rural areas and nearly 20 percentage points in urban areas.
Although the income declines in urban areas were relatively higher compared to rural areas, the difference between poor and relatively well-off households may seem small in percentage points. However, it represents a significant decline in absolute terms, exacerbating the challenges faced by vulnerable populations.
Even for non-monetary deprivations (as measured by a vulnerable group’s access to education, healthcare, nutrition etc.), one can see a sharp rise in absolute and relative poverty measures.
According to the Hunger Watch national survey of the Right to Food campaign, a crisis emerged in December 2021 – January 2022 due to declining incomes and severe food insecurity, especially among the economically vulnerable and marginalized sections of society:
- 80% of people reported some form of food insecurity, and 25% reported severe food insecurity, such as skipping meals, cutting back on food, running out of food, not eating throughout the day and going to bed hungry
- 41% of respondents said the nutritional value of their diet had worsened compared to pre-pandemic times
- 67% of people could not afford cooking gas in the month before the survey, further reducing their ability to cook
Also, a report by Pew Research Centre highlights that around 75 million more people in India fell into poverty in year 2022 because of the pandemic-induced economic recession, compared with what it would have been without the outbreak. That number for India accounts for nearly 60% of the global increase in poverty in 2020. In that study, it defined the poor as people who live on $2 or less daily.
| Absolute Increase in Poverty in India due to the Pandemic | 75 million |
| Global Increase in Poverty (2020) | 125 million (which implies that India’s 75 million increase contributed 60% to global poverty increase) |
Source: Infosphere CNES (Data from Pew Research Centre)
More recently, The State of Working India Study conducted by Azim Premji University offers valuable insights into the impact of COVID-19 on Indian households.
The study reveals that from March to October 2020, households experienced a significant loss of income, with an average decline of 22% in cumulative income. However, the income loss was more pronounced among poorer households, resulting in a substantial increase in poverty rates across the country. The APU analysis primarily relies on monthly household income data from the CMIE-CPHS, along with data from the India Working Survey (IWS) and Azim Premji University Covid Livelihoods Phone Survey (CLIPS).
CMIE-CPHS method refers to the Consumer Pyramids Households Survey (CPHS) which is a comprehensive and nationally representative survey conducted by the Centre for Monitoring the Indian Economy since 2014.
Regardless of which method one uses, the larger issue underlying the methodological concern to poverty measurement in India is a crisis of poverty (and welfare) statistics in a rapidly politicising and compromised statistical infrastructure, making any critical scrutiny erroneously difficult.
A crisis of poverty-statistics in Modi’s India
Poverty estimates, as rightly argued by Himanshu, “Are not just an academic exercise but are crucial parameters to judge policy outcomes and the overall functioning of the government”.
Our own Centre’s research team, while creating the Access Equality Index (AEI) in exploring nonmonetary forms of deprivations had discussed the wider implications of states across India being asymmetrically ranked on providing ‘access’ to basic social, economic services (from food, healthcare, education, job security, finance, legal recourse-to name a few).
What’s unfortunately happening is that research in Indian social sciences, not just in economics, has broadly transitioned to ‘proving hypothesis I or II’ rather than seeing the ‘data for what it actually is’ and then making reasonable conclusions.
In other words, data is used for theory-validation rather than the other way around.
There is more to it…
Growth alone is a bad indicator of quality of life as it fails to tell us how deprived people are doing. Thinking of developmental goal in terms of utility has perhaps the only merit of looking at what processes do for people in letting them ‘be’ what ‘they want to be’.
Poverty, for worse, represents a state of powerlessness – lack of opportunity and possible upward-mobility for an identified group, one that often lives/positions itself on the bottom of consumption-income pyramid.
Part of the reason there are conflicting estimates of poverty for the same period is the loss of reliable data and a yardstick to measure poverty and inequality after 2011-12.
There is a poverty of statistics that crowds out any meaningful policy or academic discourse on the statistics of poverty – and much of other social policy.
Economists, dare I say, are increasingly toeing the government narrative when it suits them, and oft dismiss any critical insight that brings the government (or its own policy-methodology) to account.
(Deepanshu Mohan is a professor of economics and director, the Centre for New Economics Studies, Jindal School of Liberal Arts and Humanities, OP Jindal Global University. Courtesy: The Wire.)
❈ ❈ ❈
In another article also published in ‘The Wire’, ‘Three Charts: What the Modi Government Wants us to Forget Before the 2024 Lok Sabha Polls’, Deepanshu Mohan adds:
What really matters
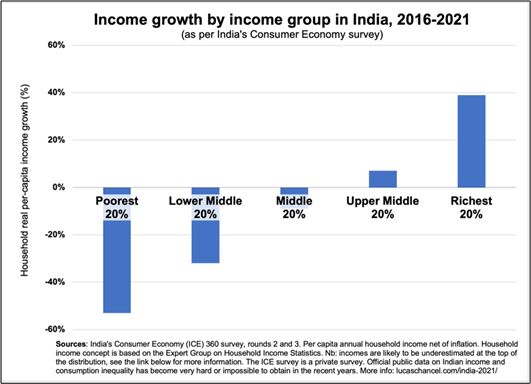
In India, at this point, two pressing issues strike out: rising income & access inequality, and the rising gap between output-employment creation for millions of (aspiring) workers across the country.
If we look at the income growth by income group from 2016 to 2021 in India, the top 20% rich have seen almost a 40% rise in their income growth while the middle 20%, lower middle 20% and poorest 20% have all seen a negative income growth. This explains how rising income inequality has exploded in the last six to seven years under the Modi government era of economic policies.
From even an access equality standpoint, as studied and explained by the Centre for New Economics Studies (CNES), assessing how Indian states can be measured in terms of ensuring ‘access’ to basic social, economic public goods (education, healthcare, social security, legal recourse, finance) the actual situation for most Indians couldn’t be worse, which, when combined with a rising inflationary tax guided by colluding corporate greed and instances of price gouging (backed by government support) is eroding the way of life and standard of living for the ‘poor’ and ‘low-income’ class as a whole.
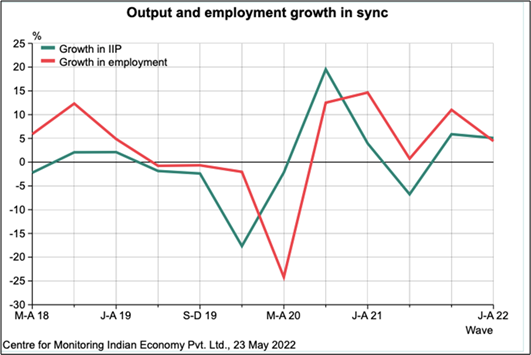
If we look at output-employment growth over the last six to seven years, particularly from the post-demonetisation (2016) period, there has been a sharp fall in the overall output (if we only look at industrial production levels) and in the aggregate employment rate of the eligible job-seeking population.
The gendered effects of these trends are even more striking, where the female employment rate has dropped from 11.88% (2016-17) to 7.96% (2021-22). In urban areas, for women, the employment rate has dropped from 10.77% t0 5.57% in the same period.
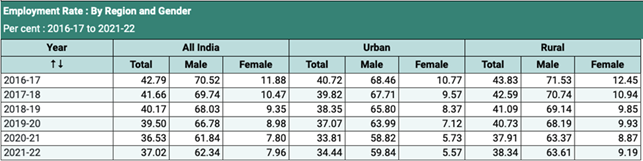
Source: CMIE Employment Data
When anyone looks at these three charts with other cumulative set of data points, it is difficult to acknowledge, or ascertain, how a party, such as the BJP, under Modi, which has actually done very little for the middle class (in terms of creating new jobs and income mobility opportunities), further added to the growing inequality amidst rising prices, making the ‘poor’ more vulnerable, at the hands of a growing narrow class of elites (usurping greater financial, corporate and money control), has continued to remain electorally ‘popular’, while garnering more electoral votes from the very states (like UP, MP, Rajasthan, Chhattisgarh, etc.) where these economic data trends signal their worst position (as compared to 2014).
❈ ❈ ❈
‘Hunger, Undernutrition Stalking India; Placed Worse Than Least Developed Nations’
Prabhat Patnaik interviewed by Subhoranjan Dasgupta
[Which adjective would you use to pinpoint the nature and condition of the Indian economy – ‘baffling,’ ‘inexplicable,’ or purely ‘criminal’? While one side of the coin says that India is projected to become a $5 trillion economy and will soon emerge as the third-largest economy in the world, the other side emphasises that around 11% of the population is poor in India, according to World Bank data, and 189.2 million people still go to bed hungry every night.
Note that India has not declared its poverty figures since 2011; the National Sample Survey Office was about to release a survey in 2017-18, but the government stopped its publication.
Emeritus Professor Prabhat Patnaik, a distinguished economist from Jawaharlal Nehru University, delves into this crucial subject in a conversation with Subhoranjan Dasgupta.]
● ●
Subhoranjan Dasgupta: In December 1984, I asked Günter Grass, arguably the greatest novelist of post-war Europe, and a trenchant critic of North-South divide as well as globalisation: What disturbed you most in my country? His answer was, “A sea of raging poverty pockmarked by a few islands of vulgar luxury peopled by citizens, who are most callous and smug.” Does the same picture prevail in 2024?
Prabhat Patnaik: Very much so. The fact that the gap between the rich and the poor has widened dramatically will be readily conceded. Chancel and Piketty, who use income tax data to estimate the share of the top 1% in national income, as a measure of inequality, found that this share, which had gone down to 6% in 1982, was 22% in 2013-14 which was higher than any year since the Income Tax Act was introduced in India in 1922. It was much the same in 2014-15, the last year for which they made an estimate.
No matter what reservations one may have about their estimation method, the figures are too striking to be ignored. But many would claim that while inequality may have increased, poverty has come down because of our high growth rate and would cite, in support of their claim, the Multidimensional Poverty Index (MPI) prepared by the UNDP (United Nations Development Programme), which shows a steep decline in the Headcount Poverty Ratio from 29.17% in 2013-14 to 11.28% in 2022-23.
The MPI, however, is based on intellectual confusion.
Every mode of production has the poor within it displaying a particular set of characteristics. Hence, every mode must have its own criteria for identifying poverty. Under feudalism, children in a poor family would be starved, left uneducated, and intensely exploited by being forced to join the workforce, but children in a poor family under capitalism, especially advanced capitalism, would be going to poor schools, having poor healthcare facilities, living with dilapidated furniture and run-down gadgets in squalid surroundings, and being pushed into crime.
If we define poverty simply in terms of, say, whether children go to school or not, then we would be mistaking the sheer introduction of capitalist modernity as a reduction in poverty, and needless to say, there would be no poverty at all so measured in even a middle-income country.
The MPI is a weighted index using criteria for a household to be considered non-poor, like access to piped water, non-thatched dwelling (which could be merely a one room hut with a metal roof), toilet; having a bank account (whether or not the balance is zero); it gives only one-sixth weight to what is misleadingly called a nutrition indicator, namely the body mass index (BMI), which does not actually measure nutritional status. Since it is a ratio (weight in kilograms divided by the square of height in metres), it can have exactly the same value for persons of normal weight and height, as for persons of the same age who are seriously undernourished and stunted. Even the latter, therefore, would not be considered poor.
In a society like ours, where different modes of production coexist, poverty should be defined in terms of some supra-mode index. Access to a minimum nutrition level, though downplayed by the MPI, has traditionally been such an internationally accepted marker. If we take access to 2,200 calories per person per day in rural India and 2,100 calories per person per day in urban India, as the benchmarks for defining poverty as the Planning Commission had done since 1973, then the proportion of the poor rose from 58% in 1993-94 to 68% in 2011-12 to over 80% in 2017-18 in rural India. On the same dates, the proportions were 57%, 65%, and an estimated 60% in urban India. The increase in nutritional deprivation is, therefore, indubitable and confirms Günter Grass’s impression.
SD: Some economists insist on the ‘determining’ figures of the GDP and per capita income to challenge, as they say, the ‘inveterate pessimists’. How would you react to their emphasis, particularly, when you recall that not only Joseph Stiglitz and Amartya Sen but also Simon Kuznets, who designed the GDP, have focused on its limitation as a genuine marker? Some countries, like New Zealand, have already rejected the GDP as a dependable evaluator.
PP: I find it strange that even people who should know better still take so much pride in the GDP growth rate. Apart from the fact that our growth rates are exaggerated, as a host of authors from Pronab Sen to Arvind Subramanian to Ashoka Mody have emphasised for different reasons, the GDP itself is conceptually inadequate for capturing well-being. This is not just because in the service sector, it is impossible to distinguish between a transfer and the purchase of an output; above all, it is because the distribution of output among the people is what matters.
In the old days some oppressive Maharajas used begar or corvee labour to build palaces for themselves. The construction of such palaces would boost the GDP but surely not be lauded as welfare-augmenting.
The reason for the current emphasis on GDP serves an official purpose. It can be used to legitimise transfers to big capitalists, especially crony capitalists, at the expense of the working [class] people on the spurious plea that they would make investments and boost the GDP, which is supposedly a good thing. Through the emphasis on the GDP, the nation’s interest is made identical with the interest of crony capitalists.
SD: We agree that the stock/share market is soaring. But how many Indians are connected with the takeaways guaranteed by the stock market? What is the actual percentage of the beneficiaries?
PP: Only about 3% of India’s population is reportedly connected with the stock market compared to 55% in the US. Even in China, the figure is higher at 13%. This does not, of course, mean that ordinary people’s money is not invested in the stock market, but it is invested through financial intermediaries, because of which people are proximately insulated from stock market risks.
An important reason behind introducing the new pension scheme was to increase the reach of the stock market and make more people bear stock market risks. But the reaction against it shows people’s scepticism regarding the stock market. The people at large, therefore, have little to celebrate from a stock market boom. Even productive investment decisions are little influenced by the ongoings in the stock market, being largely determined by the expected growth of markets for goods.
SD: In FY23, banks in India waived loans worth Rs 2.09 lakh crore, of which 52.3% were loans from large industry houses. This munificence for the super-rich was followed by another drastic decision – the welfare measure for the poorest of the poor MGNREGA will henceforth benefit only those who have Aadhaar cards, which means, millions stand to be excluded. How do you explain this colossal dichotomy?
PP: Such dichotomy is a hallmark of right-wing governments. This government, on one pretext or another, has been trying to whittle down the MGNREGS. The drastic and ill-thought-out lockdown on account of the COVID-19 pandemic saw thousands trekking back to their villages; they were saved because of MGNREGS, whose outlay had to be increased. But now immediately afterwards, the effort to truncate MGNREGS has started again.
On the other side, loan waivers given to big capitalists by nationalised banks are, at one remove, just budgetary transfers. The loans so waived are partly just filched, and partly represent advances made under government direction for infrastructure investment that cannot be repaid. The colonial government had provided guaranteed returns for such investment; the National Democratic Alliance government likewise makes nationalised banks bear the risks involved. Its so-called economic “strategy” lies not in increasing people’s consumption but in inducing big capitalists to invest in infrastructure, rather like what the Russian economist Mikhail Tugan-Baranovsky had visualised, namely “investment for investment’s sake”.
SD: Whenever international agencies, which are not enemies of the present dispensation, claim that three out of four Indians go underfed in the country, or India is ranked 111 out of 125 countries in the Global Hunger Index, economists serving the government raise a howl of protest. Where does the truth lie? Are the international agencies prejudiced Cassandras or are they impeccably impartial?
PP: As I mentioned above, the increase in nutritional poverty in the neo-liberal era is an indubitable fact. The recent post-COVID-19 distribution of free foodgrains may have moderated [its impact], but not nullified it. This again takes us back to what prevailed in the colonial period. The last half-century of colonial rule had seen an immense increase in nutritional poverty in British India, which was reversed, though not fully, by strenuous efforts of the post-independence governments prior to the introduction of neo-liberalism in the early 1990s. After the introduction of neo-liberalism, while the overall per capita availability of foodgrains declined sharply up to 2008 and has still not climbed back to the pre-reform level, its distribution across the population has become more unequal, resulting in the calorie deprivation figures quoted earlier.
It is not just the World Hunger Index that attests this. Even the National Family Health Survey, whose data are used by the MPI, shows that the prevalence of anaemia among women aged 15-49 rose from 53% in 2015-16 to 58% in 2019-21. Hunger and undernutrition are stalking the country. India today is worse placed than both Sub-Saharan Africa and the “Least Developed Countries”.
(Courtesy: The Wire.)