❈ ❈ ❈
The Hidden Cost of India’s Economic Boom: Inequality at Historic High, as Wealth and Income Growth Leave Out Millions
Kavitha Iyer
In July 2025, soon after the World Bank’s Poverty & Equity Brief placed India fourth among the world’s most equal nations based on consumption expenditure, the government of India’s Press Information Bureau issued a release declaring it a “remarkable achievement”, crediting it to “consistent policy focus” on reducing poverty, expanding financial access and delivering welfare support.
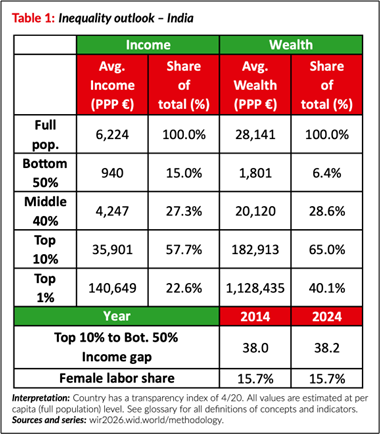
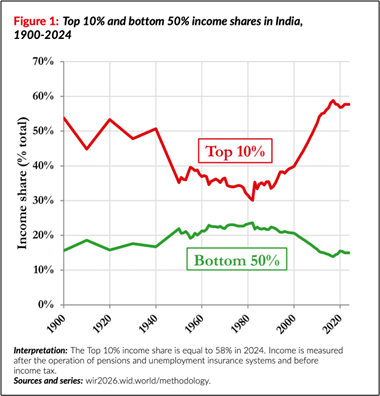
Five months later, the World Inequality Report has said inequality in India is “among the highest in the world”, showing little movement in recent years. The top 10% of earners capture 58% of national income, while the bottom 50% receive only 15%, said the report, released on 10 December. Wealth inequality is worse than income inequality—the wealthiest 10% of Indians hold nearly two-thirds of the country’s wealth; the richest 1% hold 40% of it.
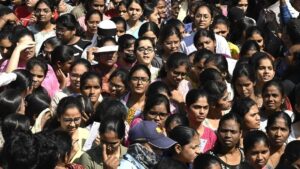
Between 2014 and 2024, this income gap between the top 10% and the bottom 50% remained stable, and women’s participation in the labour force continued to be very low, at 15.7%, also showing no improvement over a decade. The global average for female labour force participation was 49% in 2024. (The government of India claims, however, that female labour force participation is 41.7%, mainly on account of counting self-employed women in agriculture, unorganised work and unpaid work.)
India, home to a sixth of humanity, reflects a global trend on wealth and income.
The report, published by the World Inequality Lab and co-authored by Ricardo Gómez-Carrera of the Paris School of Economics along with French economist Thomas Piketty and others, has found that the top 0.001% of the world’s ultra-rich—fewer than 60,000 individuals—owns three times more wealth than the entire bottom half of the world population combined. These 60,000 people own 6% of global wealth.
Based at the Paris School of Economics, the World Inequality Lab is a research centre focused on the study of inequality and public policies that promote social, economic and environmental justice.
“Extreme inequalities are unsustainable—for our societies and for our ecosystems,” said Lucas Chancel, co-author of the report and co-director of the World Inequality Lab. “Based on four years of work by over 200 researchers on every continent, this report offers a toolbox to inform public debate, to grasp how economic, social and ecological inequalities evolve and intersect—and to drive action.”
Its significance for India lies in what these patterns of inequality mean for long-term socio-economic growth. Research shows that high levels of inequality hamper broad-based growth and citizens’ ability to move up the socioeconomic ladder; income and wealth gaps entrench unequal opportunity, worsen health and education outcomes for the poor, and lock communities into intergenerational disadvantage. Extreme wealth inequalities may distort democratic institutions, as economic power spills into political influence, shaping policy priorities, access to justice, control of the media, etc.
The 2026 report is the third instalment in this series, after previous editions in 2018 and 2022.
In 2024, Piketty and Chancel co-authored Income and Wealth Inequality in India, 1922-2023: The Rise of the Billionaire Raj, a paper that put into perspective myriad ‘success stories’ on the Indian economy, including projections on GDP growth far exceeding that of any major economy and also higher than the International Monetary Fund’s projections at the time. Their paper said India’s recent years of growth had produced income and wealth inequality; concentration of wealth among the ultra-rich top 1% of people in India is worse than in the US, Brazil and South Africa; and distribution of the spoils of growth was more egalitarian under even the British.
“Inequality is silent until it becomes scandalous,” said Ricardo Gómez-Carrera, lead author of the World Inequality Report 2026. “This report gives voice to inequality—and to the billions of people whose opportunities are frustrated by today’s unequal social and economic structures.”
The ‘National Champions’
Increasingly in India, the concentration of economic power has been mirrored in industry too, with market share across several sectors clustered around a very small set of conglomerates.
In 2023, former Reserve Bank of India deputy governor Viral Acharya wrote about the growing footprint of the ‘Big-5’ Indian industrial conglomerates—Reliance, Tata, Adani, Aditya Birla and Bharti Telecom—whose total share of assets in the non-financial sectors rose from 10% in 1991 to 18% in 2021. Industrial concentration fell after liberalisation in the 1990s, but rose in more recent years, supported by a conscious industrial policy of creating “national champions”, Acharya’s paper said. Consolidation by large conglomerates came at the expense of public-sector firms and other private-sector firms.
The average Herfindahl-Hirschman Index (HHI) score for eight major industry sectors also jumped to 2,532 in 2024-2025 in India, crossing into the ‘highly concentrated’ zone (score above 2,500), up from 1,980 in FY15 and 2,167 in FY20. The HHI is a tool used to measure market concentration and is commonly used by antitrust regulators to assess how monopolistic a market is becoming.
The World Inequality Report is only the latest in a growing body of research on India’s acutely asymmetrical growth story and its structural imbalances. Civil society organisation Oxfam India’s 2023 report titled Survival of the Fittest said post-pandemic India’s bottom 50%—roughly 700 million people—received only 13% of national income and owned less than 3% of the country’s total wealth.
A report commissioned by the South African presidency of the G20 in 2024 said India’s richest 1% expanded their wealth by 62% between 2000 and 2023.
The 2024 iteration of the UBS Billionaire Ambitions Report said India’s billionaire count more than doubled over the preceding decade, to 185, their total wealth trebling. (The 2025 report said India’s billionaire wealth is holding steady.) Their collective wealth is reported to be in the range of Rs 98 lakh crore, more than the GDP of Saudi Arabia.
Inequality is Not Inevitable
In her foreword to the World Inequality Report 2026, economist Jayati Ghosh argues that today’s extreme inequality is not a structural inevitability but the outcome of policy decisions.
“Progressive taxation, strong social investment, fair labour standards, and democratic institutions have narrowed gaps in the past—and can do so again,” writes Ghosh, professor of economics at the University of Massachusetts Amherst and previously professor at the Jawaharlal Nehru University in New Delhi.
The authors of the Billionaire Raj paper, Nitin Kumar Bharti, Lucas Chancel, Thomas Piketty and Anmol Somanchi, also suggested, in a May 2024 follow-up note to their paper, reinstating some wealth and inheritance taxation targeted at India’s richest households. Their proposal was for an annual wealth tax and an inheritance tax on those with net wealth exceeding Rs 10 crore, equivalent to the top 0.04% of the adult population (a mere 370,000 adults), who currently hold over a quarter of India’s total wealth.
In a baseline scenario, a 2% annual tax on net wealth exceeding Rs 10 crore and a 33% inheritance tax on estates exceeding Rs 10 crore in value would generate 2.73% of India’s Gross Domestic Product in revenues, they said, adding that explicit redistributive policies could support, for example, doubling expenditure on public education.
The World Inequality Report 2026 echoes this direction, recommending progressive taxation, including wealth taxes on multimillionaires, as a lever for correcting the concentration of economic power.
The 2024 G20 paper by a committee of independent experts led by Nobel Prize winner Joseph E Stiglitz said there was no magic bullet to reduce inequalities, but offered a “menu of prudent policies” including progressive taxation and an international panel on inequality.
Much like governments’ agreed-upon nationally determined contributions to cut greenhouse gas emissions, governments could also commit to national inequality reduction plans with clear goals to reduce income and wealth inequality, it suggested. “Such an approach could eventually aim for the total income of the top 10% to be no more than the total income of the bottom 40%,” the report said.
Taxing the Billionaires
India currently does not have a wealth tax, having abolished it in 2016–17, alongside a broader retreat from wealth taxation across OECD countries between the mid-1990s and 2018. Global conversation has shifted in recent years, however, and taxation of the ultra-rich has re-emerged on political agendas in various parts of the world.
In a 1 December referendum, Switzerland voted overwhelmingly against a proposed 50% levy on gifts or inheritances above 50 million Swiss francs, a measure intended to finance climate and welfare programmes. In the last few months of 2025, several high-profile billionaires in the UK opted to relocate out of the country over concerns about further taxes on the super-rich.
In September 2025, more than 50,000 citizens marched on the streets of Paris calling for proposals to ‘tax the rich’, and against austerity measures in France. Many voiced their support for the proposed ‘Zucman tax’, a 2% levy on assets worth over €100 million, named after economist Gabriel Zucman, a proposal the French parliament rejected in October 2025. Zucman, founding director of the research organisation EU Tax Observatory, completed his PhD in Economics from the Paris School of Economics, under Piketty.
At a July 2024 meeting of G20 finance ministers in Rio, even as the US resisted it, countries agreed to start a dialogue on fair and progressive taxation, including of ultra-high-net-worth individuals. Brazil’s President Luiz Inacio Lula Da Silva has backed Zucman’s proposal for a 2% levy on billionaires.
In a release, Zucman, scientific co-director of the World Inequality Lab, was quoted as saying the World Inequality Report 2026 provides measures to address income, wealth, gender disparities, regional inequalities and political cleavages within countries. “All these facets of inequality are connected and will shape the evolution of our societies,” he said.
Protecting Capital
In December 2024, at an event organised by a Delhi-based think-tank and the Delhi School of Economics, Piketty said India should take an active role in taxing the rich. Chief economic adviser to the government of India, V Anantha Nageswaran, who spoke at the same event, said higher taxes could lead to capital flight. “Taxing capital less may not make them invest, but taxing capital more will drive away capital,” he said.
In April 2024, finance minister Nirmala Sitharaman, making comments to journalists after casting her vote in Bengaluru, said an inheritance tax, proposed by the Congress poll campaign, could hit the “middle and aspirational classes”, making the inheritance of savings or small land parcels expensive.
“If such wealth creators are going to be punished purely because they have some money kept behind, India’s progress in the last ten years would just go for a zero,” she said.
India cut corporate tax rates in 2019, a stimulus seeking a “multiplier effect in the economy” with anticipated job creation and income growth. Since then, the burden of tax has shifted, and personal income tax overtook corporate tax revenues in 2023-24 for the first time; corporate profits rose nearly threefold from Rs. 2.5 trillion in 2020- 21 to Rs. 7.1 trillion during 2024-25; and corporate profit to GDP ratio (indicating the sector’s health within the broader economy) touched a 15-year high in 2024. Meanwhile, corporate loan write-offs continued, touching Rs 6.15 lakh crore between 2020 and 2025.
Salary growth, on the other hand, remained low. “While profits surged, wages lagged,” said the Economic Survey of India presented to Parliament in January 2025.
Wages lagged, as did job creation. “A striking disparity has emerged in corporate India: profits climbed 22.3 per cent in FY24, but employment grew by a mere 1.5 per cent,” the report said. It cited a State Bank of India analysis of 4,000 listed companies that recorded a 6% revenue growth, while employee expenses rose only 13%, down from 17% the previous year, “highlighting a sharp focus on cost-cutting over workforce expansion”.
For all the impressive official numbers on economic growth, employment growth has barely moved, widening the gap between rising output and the lived reality of a workforce struggling for stable, decent work.
Agriculture, despite its shrinking contribution to GDP, remains the largest employer of Indians; about 80% of all labour in the country is informal, precarious, lacking social security or job security, and earning low wages. As the Harvard Business Review put it, in the country with the “world’s largest and youngest workforce, there are very few good jobs to be had.”
Gaps Between Policy & Experience
In its press release issued in July on India’s “path to income equality”, the government cited a different set of policies, listing schemes and initiatives that improve financial access, deliver welfare benefits, and support vulnerable and underrepresented groups. Many of those schemes, however, are also faltering on the ground.
For example, while the PM Jan Dhan Yojana is presented as a financial inclusion success story, including a Guinness world records for the most bank accounts opened in a single week, the government has acknowledged that a quarter of all Jan Dhan accounts are inoperative—15 crore accounts, or 26% of of the total 57.07 crore accounts that are meant to give beneficiaries direct access to government benefits.
Also listed as a key policy measure against poverty, Ayushman Bharat, “the world’s largest government health insurance scheme”, is meant to provide health coverage of up to Rs 500,000 per family. The government informed Rajya Sabha on 9 December, however, that more than 2 crore claims amounting to more than Rs 28,000 crore had been settled in the last financial year under the scheme—an average claim settlement of about Rs 14,000.
Article 14 has reported that delayed reimbursement, disputes over treatment costs, cases of fraud, funding shortfalls, and hospitals cutting corners have impaired Ayushman Bharat, with rising demand not matching its claims.
The release said nothing about the sources of inequality, such as market power, caste, spatial discrimination, feeble labour rights, unregulated or poorly regulated extraction by natural resource companies, etc.
“We live in a system where resources extracted from labour and nature in low-income countries continue to sustain the prosperity and the unsustainable lifestyle of people in high-income economies and rich elites across countries,” Jayati Ghosh said, following the release of the World Inequality Report 2026.
These patterns are not accidents of markets, she said. “They reflect the legacy of history and the functioning of institutions, regulations and policies—all of which are related to unequal power relations that have yet to be rebalanced.”
[Kavitha Iyer is a senior editor with Article 14 and the author of ‘Landscapes of Loss’, a book on India’s farm crisis. Courtesy: Article 14.com, a joint effort between lawyers, journalists, and academics that provides intensive research and reportage, data and varied perspectives on issues necessary to safeguard democracy and the rule of law.]
❈ ❈ ❈
G20 Report Says Top 1% Indians Grew Richer by 62% in 2000-23, Calls for New Global Inequality Body
The Wire Staff
06 November 2025: India’s top 1% grew richer by 62% between 2000-2023, a new report by experts on global wealth inequality has found.
According to the report, the richest 1% also increased their share of wealth in over half of all countries, accounting for 74% of the global population.
While the global top 1% amassed 41% of all new wealth created between 2000-2024, the bottom half grew its wealth by just 1%, the report said.
The study, commissioned by the South African Presidency of the G20, was led by Nobel laureate Joseph Stiglitz and authored by the 2025 G20 Extraordinary Committee of Independent Experts on Global Inequality, including Jayati Ghosh, Adriana Abdenur, Winnie Byanyima, Imraan Valodia and Wanga Zembe-Mkabile.
Stiglitz warned that global inequality had reached “emergency” levels and posed a threat to democracy, economic stability and climate progress.
Countries with high inequality were seven times more likely to experience democratic decline than more equal countries, the report said.
Citing the rise in per capita incomes in populous countries like India and China, the report said that inter-country inequality seemed to have reduced as high-population countries reduced the share of high-income countries in the global GDP.
“Extreme inequality is a choice. It is not inevitable and can be reversed with political will. This can be greatly facilitated by global coordination, and in this regard, the G20 has a critical role,” the report said.
“Since 2020, global poverty reduction has slowed almost to a halt and reversed in some regions. 2.3 billion people face moderate or severe food insecurity, up by 335 million since 2019. 26 and half the world’s population is still not covered by essential health services, with 1.3 billion people impoverished by out-of-pocket health spending,” it added.
The report also noted the shrinking middle class around the world. “There has also been a weakening of the middle-income groups in many parts of the world, reflected in more insecure incomes and precarious material lives. In some countries, there is strong evidence of an evisceration of the middle, which can have significant consequences for economic and political stability,” it said.
The report proposed establishing an International Panel on Inequality (IPI), similar to the Intergovernmental Panel on Climate Change (IPCC), to monitor global trends and guide policymaking.
IPI, to be launched while South Africa presides the G20, would give governments “authoritative
assessments and analyses of inequality.”
“The idea of the Panel is inspired in part by the success of the IPCC…Like climate change, unrestrained and growing inequalities also represent a major threat to the global community. It is imperative that we have better knowledge about its evolution and how proposed policy changes might alleviate it—or make it worse,” the report said.
[Courtesy: The Wire, an Indian nonprofit news and opinion website. It was founded in 2015 by Siddharth Varadarajan, Sidharth Bhatia and M. K. Venu.]
❈ ❈ ❈
World Bank Miracle: How to Show Rising Poverty as Declining!
Utsa Patnaik
Of late, there have been several academic papers and media write-ups on the World Bank’s 2025 claim of steeply declining extreme poverty in the world, especially in Asia. It would be wonderful if this was true, but it is not true.
This claim is spurious, arising from a statistical legerdemain that the World Bank and governments have practised for many decades, ignoring all criticism. For half a century, they have repeatedly underestimated poverty line expenditure until by now their poverty lines are so incredibly low that they do not permit human survival.
The World Bank has declared 5.25% of the Indian population to be in extreme poverty using a poverty line of Rs.62 per day. The NITI Aayog had arrived at its overall 5 % poverty ratio for 2022-23 by applying poverty lines of Rs.57/69 per day for rural/urban India. These sums would have bought daily a little less than 2.9/3.5 litres of the cheapest bottled drinking water, while the poverty line is supposed to meet all daily food as well as non-food (medical, utilities, manufactures, rent, transport) expenses. All except homeless beggars are dead before reaching these spending levels.
We can expect by next year the claim that India has achieved zero extreme poverty, when there are no survivors at all at the poverty line. The real poverty line at which a bare minimum level of nutrition can be reached, is at least three times the official poverty line and at least 65% of the population falls below it.
The World Bank has been sending advisors to developing countries to train their economists on poverty estimation procedure under its ‘capacity building programme’.
China’s poverty line was set on Bank advice by taking the 1978 poverty line of 100 yuan a year updated to 1997, and adding non-food spending. China’s 2019 claim of ‘zero poverty’ used an official poverty line of 8.8 yuan per day which would have bought 2.1 litres of bottled drinking water there, and nothing else. No survivors remained at this artificial, never actually observed spending level, and this zero number of persons observed was interpreted perversely as the achievement of ‘zero extreme poverty’. Immediately after this the poverty line was raised to 11 yuan a day for 2020.
Informed analysts in China say that at least one-fifth of the population is unable to spend a bare subsistence minimum which they put at about 1,000 yuan per month, three times the official poverty line. There is thus no actual achievement of 5% poverty in India and no zero poverty in China.
However, more recently, China has launched a massive project of sending many thousands of trained persons, to rural areas in particular, to physically identify, with the help of local communities, the most deprived families and has been giving large transfers to genuinely reduce and eventually eliminate poverty. On a smaller scale, Kerala in India has followed a similar policy and with its strong community networks and volunteers, has had success in identifying and rehabilitating destitute families.
The World Bank uses the national local currency poverty lines of several poor countries and merely adjusts them upward for purchasing power to US dollar, averaging to obtain its present global poverty line of $3 per day. When applying this line to an individual country, say India, it does the reverse adjustment and deflates the nominal rupee-dollar exchange rate by about 0.28 to arrive at the rupee equivalent of $3, which is always very close to the official Indian poverty line.
Why are all official poverty lines in fact artificially constructed, give spurious result of decline, and end up below survival level? Because for many decades under World Bank advice, official poverty lines have been de-linked, without any explanation, from satisfying any nutrition standard whatsoever. Only the very first estimate of poverty in each country was based correctly on obtaining a ‘poverty line’ that enabled the population to reach a specified nutrition standard; every later estimate was incorrect because it simply applied a Laspeyres price index to the initial figure to bring it forward to later years, without ever asking the question whether the nutrition norm continued to be satisfied. The Laspeyres index is base-weighted with respect to quantities namely, the particular consumption basket of items and quantities of good and services purchased at the poverty line in the base year is held constant and its value merely updated by the change in prices.
The base year in India and China was 1973 and 1978, respectively, by now 52 years and 47 years in the past. Suppose that when making its very first poverty estimates in 1973 and 1978, the governments of India and China had announced that they were taking the updated cost of a consumption basket that prevailed in the year 1921 and 1931, respectively, they would have been laughed at. But today governments and the Bank talk glibly of current poverty on the basis of a half century old basket without arousing any criticism, because the educated public has no idea of the absurdity of the estimation procedure they use.
In 1973, in rural India Rs.49 per month per head was needed to reach a nutrition norm of 2200 calories per day, and 56.4% of persons spending less than this was the official, correct poverty ratio. By 2011-12, satisfying the same nutrition norm required Rs.1,320 per month spending and 66.8% of persons fell below this, a marked rise over the initial 56.4%. But official estimators had silently abandoned the nutrition norm after 1973, and merely price indexed the base year figure giving Rs.816 as the official poverty line with 25.7% of persons falling below it, compared with the correct Rs.1,320 and 66.8%.
Calorie intake obviously was much lower at the official poverty line, rendering the claim of poverty decline spurious, since the poor were being counted below a declining and not a constant nutrition standard.
Similarly, the correct 1973 urban poverty line of Rs.56.6 per month satisfying the 2,100 calories norm, gave a poverty ratio of 49% which by 2011-12 rose substantially to 62%, with the same 2,100 calories standard requiring Rs.2,130 to be spent. The official poverty line for 2011-12 was only Rs.1,000 yielding a mere 13.7% poverty ratio, and allowing only 1,775 calories daily, a fact never mentioned.
Every new official poverty line, over time, gave lower and lower nutritional intake, until the ultimate absurdity has been reached by now (as I predicted in a 2013 paper) of a poverty line below physical survival level. And the absence of observations because no one survives, is celebrated as zero extreme poverty!
Note, that many African countries started poverty estimation late, their base years are not more than a decade earlier, and so they register high, close to realistic levels of poverty.
Assuming a fixed consumption basket from half a century ago as in India, is equivalent to assuming away poverty, for it is precisely the changes in the availability of essential goods and services producing change in the available basket, that are important for the question of whether poverty rises or falls.
From being considered essential services that should be provided out of public funds, healthcare, utilities and education have been shifted rapidly into the sphere of private provisioning and have seen steeply higher pricing under the market-oriented reforms of the last three decades. A rising proportion of all households is unable to both meet these higher costs and maintain their nutritional standard, since their incomes have not risen adequately. The rise in household debt in India is a telling indicator.
Households that were not poor to begin with, have slipped into poverty while those already poor have suffered further nutritional decline. The National Sample Survey or NSS consumption data in India show a decline over time in average energy and protein intake per head in both rural and urban areas.
If an Olympic high jump athlete claimed improved performance by continually lowering the bar, he would be banned for life for cheating; if a school principal claimed that the percentage of failures had fallen sharply to zero from 40%, and this was found to arise from lowering the pass mark from 50 out of 100 to 2 out of 100, the principal would be sacked. But it seems that there is no international body which can discipline the World Bank into following a logical and ethical estimation procedure, and abandon the illogical and dishonest one it actually uses, that has reduced the poverty line in Asia to below survival level.
The World Bank has already rejected the Report (2020) by Philip Alston, designated as the United Nations Special Rapporteur on Extreme Poverty and Human Rights, which expressed concern at the unrealistic poverty lines used by the Bank.
No doubt, the World Bank will continue to mock the poor, telling them that millions of them have been ‘lifted out of extreme poverty’ whereas in reality ever more households facing soaring medical and other costs, are sinking into indebtedness and lowered nutrition.
[Professor Utsa Patnaik taught at the Centre for Economic Studies and Planning in the School of Social Sciences at Jawaharlal Nehru University, New Delhi, from 1973 until her retirement in 2010. Courtesy: Newsclick, an Indian news website founded by Prabir Purkayastha in 2009, who also serves as the Editor-in-Chief.]
❈ ❈ ❈
India’s Wealth Gap Grows and Average Wealth Falls, But Millionaires Surge
Pragya Singh
India ranks eighth among the ten most unequal countries in the latest edition of the Global Wealth Report, 2025, by UBS, a Swiss financial services firm. While media reports have focussed on the rise in the number of Indian millionaires, it is inequality that emerged at the centre of the country’s wealth story in 2024, finds the report’s latest edition.
Inequality overshadowed the wealth story in India over 2024, because of the high levels it has reached. According to the report, India is now as unequal as the United States – a country not just far wealthier on the whole but also better off on most social parameters.
The Gini coefficient, a mathematical model, is traditionally used to measure inequality by quantifying how evenly wealth or income is distributed within a population. Zero in the model represents perfect equality and 1 represents maximum inequality. India and the United States had the same Gini coefficient of 0.74.
This score underlines how concentrated wealth has become in India, even as sections of the population experience economic progress – like the millionaires, who now number 9,17,000 (39,000 were added in 2024).
But there is more sobering data for India. In 2024, India was among the markets where average wealth per adult, measured in US dollars, declined in real terms. The fall of just over half a per cent might appear modest, but it came at a time when many economies were posting gains.
India’s high level of inequality means a small affluent segment remains relatively insulated from the contraction. At the same time, more Indian households saw their gains erode due to currency fluctuations or inflation.
The millionaire population only serves to add another layer to this picture of inequality. In 2024, India saw a 4.4% increase in the number of dollar-millionaires: around 39,000 new entries to the list. This means wealth creation is taking place at the top, but reinforcing the imbalance highlighted by the Gini coefficient.
[This article is an extract. Courtesy: The Wire, an Indian nonprofit news and opinion website. It was founded in 2015 by Siddharth Varadarajan, Sidharth Bhatia and M. K. Venu.]