Evolution of the External Debt of Developing Countries Between 2000 and 2018
[At the end of the 1990s and in the early years of the new millennium, Developing Countries (DC) were emerging from an unprecedented debt crisis, the “lost decades of development”, which had started in 1982 with Mexico defaulting. Between 1980 and 1999 there had been at least 280 debt restructuring operations.
At the time, faced with the sheer size of the crisis and popular pressure, creditors launched emergency financing or debt relief initiatives. Since 1982, those measures have essentially guaranteed that the debt would still be paid so that creditors would not be affected by a general suspension of debt payment as had happened in the 1930s.
Moreover, new loans granted by multilateral institutions such as the IMF and the World Bank came with conditionalities that made the borrowing states more dependent on their external debt.
Such neoliberal policies also resulted in a deterioration of public services such as health care and this had very serious consequences on the capacity of governments to face the Covid-19 pandemic.
Furthermore, the suppression of tariff barriers and aid to small local producers deeply affected the DC. Not to mention that between 2000 and 2018 the total external debt of the DC tripled and that 18 countries have totally or partially suspended repayment. A new debt crisis is in the offing even though its extent and its scope are cushioned by the ongoing policy of very low interest rates in the North.
The crisis has slowed down because this low interest rate policy implemented by central banks in the North combined with massive injections of cash into financial circuits by the same central banks resulted in big capital of the North still buying debt securities in the South.
Big capital in the North (as well as capitalists in the South) still buys securities from the South because they provide much higher yield than public debt securities in the North. Capitalists in the North are convinced that if many countries of the South should suspend debt repayment as a consequence of a global crisis that has led to a sharp decrease in their revenues in hard currencies, the IMF and the World Bank would grant them new loans to prevent general defaulting. They are convinced that as private creditors, they will be repaid first because loans are granted by the IMF and other institutions on condition that the money is used first to pay private creditors. If they should nevertheless face losses, capitalists in the North know that they can rely on the help and support of powerful States in the North in the shape of tax relief and other financial aid. The motto of capitalists is “Heads: I win, tails: you lose”. They win whatever the circumstances, or almost.
In the first part of this three part series devoted to the evolution of indebtedness since the beginning of the 2000s, we shall examine the relationship between debt stock and net transfers. The following parts will turn to the threats on the debt of DC from the global and regional perspectives.]
❈ ❈ ❈
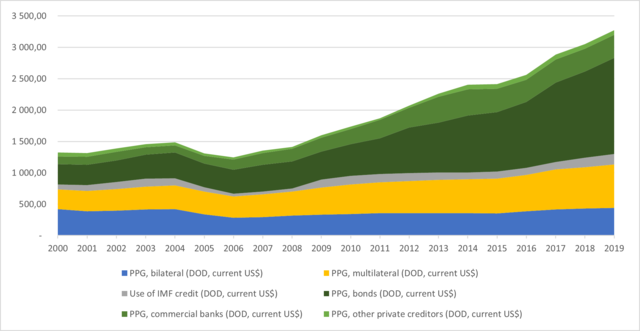
1. Structure of external debt in DC
Let us first examine the structure of the DC’s external debt from the point of view of creditors (we have rounded off the figures provided by the World Bank concerning DC indebtedness in 2018):

and from the point of view of debtors:

2. Evolution of DC’s external debt between 2000 and 2018
2.1 List of DC according to income
Population in the 135 Developing Countries in 2019: 6,438 million:
In low income countries [1] in 2019: 668 million
In middle-income countries [2] in 2019: 5,769 million
List of 29 low-income DC [3]: Afghanistan, Burkina Faso, Burundi, Central African Republic, North Korea, Erithrea, Ethiopia, Gambia, Guinea, Guinea-Bissau, Haiti, Liberia, Madagascar, Malawi, Mali, Mozambique, Niger, Uganda, Democratic Republic of the Congo, Rwanda, Sierra Leone, Somalia, Sudan, South Sudan, Syria, Tajikistan, Chad, Togo, Yemen.
List of the 106 middle-income DC [4]: Albania, Algeria, Angola, Argentina, Armenia, Azerbaijan, Bangladesh, Belize, Benin, Bhutan, Belarus, Bolivia, Bosnia-Herzegovina, Botswana, Brazil, Bulgaria, Cambodia, Cameroon, Cap Verde, China, Colombia, Comoros, Congo, Costa Rica, Côte d’Ivoire, Cuba, Djibouti, Dominican Rep., Dominica, Egypt, Ecuador, Eswatini, Fiji, Gabon, Ghana, Georgia, Grenada, Guatemala, Equatorial Guinea, Guyana, Honduras, India, Indonesia, Iraq, Iran, Jamaica, Jordan, Kazakhstan, Kenya, Kiribati, Kyrgyz Rep., Kosovo, Laos, Lebanon, Libya, Lesotho, North Macedonia, Malaysia, Maldives, Morocco, Marshall (islands), Mauritania, Mexico, Micronesia, Moldavia, Mongolia, Montenegro, Myanmar, Namibia, Nepal, Nicaragua, Nigeria, Uzbekistan, Pakistan, Palestine, Papua-New Guinea, Paraguay, Peru, Philippines, Russia, Sainte-Lucie, Saint-Vincent et Grenadines, Salvador, Samoa, American Samoa, São Tomé et Principe, Senegal, Serbia, Solomon (Islands), South Africa, Sri Lanka, Surinam, Tanzania, Thailand, East Timor, Tonga, Tunisia, Turkmenistan, Turkey, Tuvalu, Ukraine, Vanuatu, Vietnam, Venezuela, Zambia, Zimbabwe.
Table 1: Evolution of the debt stock of the net transfer (total and public external debt) of DC between 2000 and 2018
|
Total DC (long-term debt) |
||||||
|
Total external debt |
Public external debt |
Debt owed to the WB |
||||
|
Total stock |
Net transfer |
Total stock |
Net transfer |
Total stock |
Net transfer |
|
|
2000 |
1,695.49 |
– 103.29 |
1,251.67 |
– 30.18 |
192.42 |
8.07 |
|
2001 |
1,664.51 |
– 53.23 |
1,227.63 |
– 45.95 |
195.32 |
7.46 |
|
2002 |
1,678.11 |
– 78.04 |
1,264.93 |
– 57.59 |
204.93 |
– 0.02 |
|
2003 |
1,802.47 |
– 2.39 |
1,321.96 |
– 61.15 |
215.88 |
– 2.33 |
|
2004 |
1,908.25 |
17.47 |
1,362.27 |
– 36.55 |
224.13 |
2.34 |
|
2005 |
1,914.74 |
35.83 |
1,247.33 |
– 53.87 |
215.34 |
2.95 |
|
2006 |
2,072.05 |
84.08 |
1,212.16 |
– 84.79 |
189.87 |
– 0.01 |
|
2007 |
2,433.46 |
347.36 |
1,321.55 |
12.16 |
200.12 |
5.47 |
|
2008 |
2,690.78 |
62.32 |
1,372.37 |
– 25.72 |
206.87 |
7.33 |
|
2009 |
2,831.74 |
48.78 |
1,476.09 |
36.30 |
223.78 |
17.25 |
|
2010 |
3,084.27 |
571.81 |
1,612.27 |
104.30 |
241.55 |
22.50 |
|
2011 |
3,541.84 |
545.39 |
1,750.44 |
76.89 |
246.00 |
64.66 |
|
2012 |
3,979.33 |
373.02 |
1,960.36 |
133.31 |
255.88 |
11.95 |
|
2013 |
4,410.65 |
608.87 |
2,173.52 |
152.71 |
270.61 |
13.98 |
|
2014 |
4,713.42 |
317.70 |
2,330.10 |
126.48 |
274.56 |
14.88 |
|
2015 |
4,708.52 |
– 537.47 |
2,349.13 |
17.16 |
282.70 |
17.29 |
|
2016 |
5,012.75 |
– 9.45 |
2,490.14 |
58.25 |
291.62 |
13.57 |
|
2017 |
5,379.44 |
479.82 |
2,816.13 |
177.60 |
315.73 |
12.85 |
|
2018 |
5,519.20 |
218.91 |
2,933.94 |
44.48 |
324.91 |
14.77 |
Amount of public external debt of low-income countries:
- in 2000: $79 billion
- in 2018: $118 billion
Amount of public external debt of middle-income countries:
- in 2000: $1,173 billion
- with $427 billion for lower-middle-income countries
- and $745 billion for upper-middle-income countries
- in 2018: $2,816 billion
- with $1,031 billion for lower-middle-income countries
- and $1,785 billion for upper-middle-income countries
2.2 Some explanations
Table 1 bears on the period 2000-2018 [5], a stretch of time that includes debt relief measures implemented by public creditors (States of the North, the IMF, the WB, other multilateral regional banks) after the Third World debt crisis [6] that started in the 1980s.
Column 2 shows the evolution of the stock of total long-term external debt of all DC for which the WB provides data [7] (long term debt, debt owed and guaranteed by the governments of DC as well as debt owed by private companies in DC). Column 4 shows the evolution of the total stock of the long-term external debt owed and/or guaranteed by the governments of DC. Column 6 shows the evolution of the stock of long-term external debt of DC owed to the World Bank (IBRD and IDA).
Columns 3, 5 and 7 show net transfer on debt for the three kinds of stocks mentioned above.
The net transfer on debt is the difference between what a country receives as loans and what it pays back (capital and interest included, also called debt servicing). If the amount is negative, it means that for that year the country paid out more than it received.
2.3 Interpreting the table
We can distinguish between two periods, the first from 2000 to 2007-2008, and the second up to 2018.
First period: From 2000 to 2007-2008, total external debt stagnated then slowly increased from 2003 onward. From $1,695 billion in 2000 it rose to $ 2,433 bn in 2007. Public external debt remained fairly stable throughout, moving from $1, 252 in 2000 to $1,322 billion in 2007.
Simultaneously the net transfer (of total and public external debt) is largely negative, which means that DC pay back more than they borrow.
Several elements must be taken into consideration. Most DC had just experienced a major debt crisis and were still limited in what they could do. Although the main central banks’ interest rates decreased between 2000 and 2008, they were still high enough to attract investors towards Western countries and detract DC from harboring any intention to borrow. In this context, liquidities to be invested yield higher profits in countries of the North. For countries of the South, it is a time when capital flows out. Badly impacted by the structural adjustment policies demanded by their creditors, several DC made anticipated repayments to get out of the conditionalities enforced by official creditors (bilateral and multilateral creditors). This was the case for Brazil, Argentina, Uruguay, Philippines, Indonesia, Thailand, Nigeria, Algeria and Russia, countries that benefited from a rebound in the prices of commodities from 2005 onward in order to use foreign currencies to repay their external debt.
Within 6 years, DC repaid $370 billion, twice the amount of the Marshall Plan. However their (total and public) external debt did not decrease.
Second period: From 2008 onward, the situation was practically reversed. Within 10 years, their external debt doubled and more: from $2,691 to 5,519 billion for their total external debt, and from $1,372 to 2,934 billion for their public external debt. The curve of net transfers was reversed, becoming positive. DC borrowed more than they repaid.
Several elements have to be taken into consideration. The main one is the impact of the subprime crisis. In 2007 the bubble of subprime loans burst in the United States. The crisis soon spread to all major Western banks, which are all interconnected. The world of finance was faced with a collapse of the whole system. The governments of Northern countries bailed out those banks, thus contracting a huge public debt, through quantitative easing policies [8] that were urgently launched by the main central banks such as the Federal Reserve in the US and the European Central Bank. Central bank key interest rates reached historically low levels: from 4.75% and 4.25% in 2007, the Fed’s and the ECB’s rates fell to 0.25% and 1% in 2009, then 0.5% and 0.05 % in 2015. Investors were relieved and then tried to invest their cash resources in the most profitable sectors. The debt of DC provided an interesting perspective. On the creditors’ side, profits to be drawn from DC are higher than what can be expected in a Western economy that is still in crisis. Borrowers benefit from lower interest rates than had been the case. Simultaneously, from 2008 to 2013, we experienced a “super cycle for commodities”, with prices reaching unprecedented heights. As a consequence DC increased their foreign exchange reserves thanks to their rising export revenues. With a favorable economic climate, eagerly courted by investors and pushed by the international financial institutions to resort to private financing to develop their infrastructure, DC were encouraged to take on massive debt, mainly by issuing bonds on the financial markets. For countries of the South this is a capital inflow period.
Footnotes
[1] The World Bank defines lower-income countries as countries with a GNI per capita of $1,035 or less.
[2] Middle-income countries are defined by the World Bank as countries with a GNI per capita between $1,036 and $12,535. They are subdivided into lower-middle-income countries (GNI per capita between $1,036 and $ 4,045) and upper-middle-income countries, with a GNI per capita between $ 4,045 and $12,535.
[3] The list of low- and middle-income countries is based on the one provided by the World Bank. See “World Bank Country and Lending Groups”, accessed on 28 July 2020 https://datahelpdesk.worldbank.org/knowledgebase/articles/906519-world-bank-country-and-lending-groups
[4] Upper-middle-income countries are underscored.
[5] At the time this chapter was written, figures available on the WB website went up to 31 December 2018.
[6] We are referring here to the highly indebted poor countries initiative (HIPCI) and to the Multilateral Debt Relief Initiative (MDRI), launched respectively in 1996 and 2005 and concerning 39 countries.
[7] Unless otherwise stated data in this chapter are from the World Bank’s International Debt Statistics. They include 122 DC. The World Bank provides no data for the following countries: Cuba, Iraq, Libya, North Korea. For more details https://openknowledge.worldbank.org/bitstream/ handle/10986/32382/9781464814617.pdf?sequence=7&isAllowed=y
[8] Quantitative easing is a policy that consists of massive buyback of private and public securities through money creation, allegedly in order to revive the economy after a period of crisis. Critical analysis by Éric Toussaint, “2007-2017: Causes of a Ten-Year Financial Crisis”, CADTM, 30 March 2017, https://www.cadtm.org/2007-2017-Causes-of-a-Ten-Year
(Eric Toussaint is a historian and political scientist who is the spokesperson of the CADTM International, and sits on the Scientific Council of ATTAC France. Milan Rivié is with the CADTM.)