[India’s large capitalists and India’s people are both facing problems at present. These problems appear to be direct opposites of each other; but in fact they are two faces of the same phenomenon.
In the first part of this article, we described the financial situation of the corporate sector. In the second part, we describe the financial situation of the people. In conclusion, we link the two.]
❈ ❈ ❈
Part II. Deteriorating Financial Situation of the People
We had described, in an earlier note, the fall in real incomes of the masses of people in recent years, and how this fall had resulted in the decline in the sales of ordinary items of mass consumption (from soap to textiles to footwear). In this note we take a brief look at the financial situation of the people.
Since 2012, the RBI has carried out all-India “Consumer Confidence Surveys” (CCS) every two months in urban areas, and since September 2023 in rural areas as well. In these surveys, respondents are asked to compare their situation at present to their situation a year earlier with respect to various aspects of the economy. Among other things, respondents are asked to report changes in income or spending in nominal terms, i.e., without discounting for inflation. This means that, even when they report that their incomes have remained the same, these incomes would have fallen in real (inflation-discounted) terms.
The following chart shows the percentage of respondents who reported their nominal incomes to be the same or lower than the previous year. At the start, in 2012, this figure was about 50 per cent. It rose to over 90 per cent during the Covid lockdown, and has now settled around 75 per cent. If the respondents’ reporting is true, in three-fourths of the cases real incomes are declining.
This is borne out by the overwhelming majority of respondents reporting that their ‘essential spending’ is rising, which is a natural consequence of price rise. Indeed, despite curbing their non-essential spending, respondents find their total expenditure to be rising.[1]
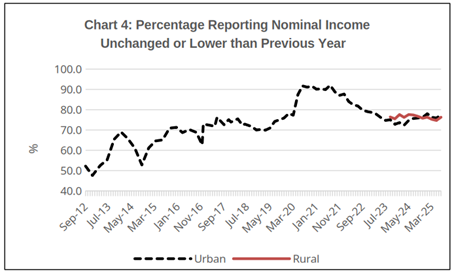
Source: RBI, Urban and Rural Consumer Confidence Survey, July 2025.
Note: Rural CCS was initiated in September 2023.
The questionnaire for the CCS includes certain other important questions, the data of which are not reported.[2] Of particular interest to us here is Question 7, namely:
How [would] you describe the current financial situation of your household?
(1) Saving a lot;
(2) Saving a little;
(3) Just making ends meet;
(4) Drawing on past saving;
(5) Running debt.
The RBI does not release the data of responses to this question.[3]
Financial distress of households and indebtedness
The Government claims that its Covid-period policies protected people’s subsistence. This was done principally by providing free foodgrains to the majority of households. However, even if we assume the quantity of foodgrains distributed was sufficient, certain other expenditures too are required for survival. If people lacked income during a lockdown, they would have had to exhaust their past savings or sell their assets. Once those savings and assets were exhausted, they would have had to go into debt. If people experience declining real incomes over a long period, growing numbers of them would fall into debt. And so we would expect to see household indebtedness rise; and we would expect consumption to be constrained by debt payments.[4]
Indeed, the picture that emerges from the data of the last few years is one of both depressed consumption (which we have discussed elsewhere) and the widespread financial distress of households:
(1) In the wake of the Covid lockdown, bank credit to individuals for consumption purposes rose sharply.
(2) The jobs and livelihoods crisis triggered by the Covid lockdown also gave fresh impetus to predatory lending by microfinance institutions to low-income families, at high interest rates. In this situation, the RBI deliberately relaxed regulations so as to promote microfinance. This, in turn, has led to a fresh crisis.
(3) Households’ dependence on informal sector moneylenders too increased in this period. Expectedly, the largest increase in such borrowing has been among the lower income groups.
(4) While banks have now checked the growth of their unsecured personal lending, they are expanding their lending against gold. The need for large and rapidly growing numbers of people to borrow against their family gold is another stark signal of financial distress.
1. Rise in personal loans
Between March 2020 and December 2024, financial sector data of household debt as a percentage of GDP show a sharp rise. This is also reflected in the national income data of financial liabilities of households over this period.[5] In 2023 researchers raised the alarm over this trend, but the Finance Ministry dismissed these fears. It claimed the rising debt was evidence of rising prosperity: “The household sector is not in distress, clearly. They are buying vehicles and homes on mortgages.” They are displaying “confidence in their future employment and income prospects.”[6]
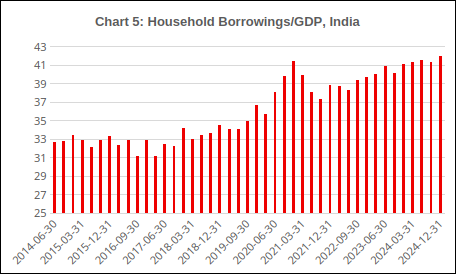
Source: Bank for International Settlements database.
While an upper layer of households may indeed have borrowed and spent on such things, it clearly was not so with the vast majority of people. Such a trend is hardly compatible with an overall slowing of growth and specifically of consumer goods production. The RBI’s latest Financial Stability Report, June 2025, makes this clear (see Charts 6a and 6b):
Among broad categories of household debt, non-housing retail loans, which are mostly used for consumption purposes, formed 54.9 per cent of total household debt as of March 2025, and 25.7 per cent of disposable income as of March 2024. Moreover, the share of these loans has been growing consistently over the years, and their growth has outpaced that of both housing loans and agriculture and business loans.[7] (emphases added)
Charts 6a & 6b: Share of Consumption Loans in Household Borrowings and Disposable Income
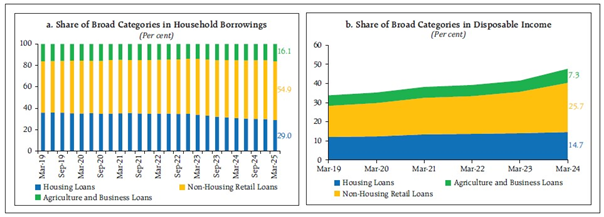
Source: RBI, Financial Stability Report, June 2025.
Note: The above data are for formal sector lenders, and do not include household borrowings from informal sector lenders. They also do not include borrowing for productive purposes.
These data are evidence of the growing dependence on borrowing for consumption purposes, such borrowing being more than a quarter of the disposable income.
The rise in banks’ personal loans was also powered by another factor, at the opposite pole of the economy. As we saw above, the corporate sector has been both flush with cash and unconvinced that demand for its products will grow. Since the corporate sector was uninterested in borrowing for investment, banks aggressively sought to expand personal loans for consumption.
In November 2023, alarmed at the steep rise in personal loans by banks (as well as bank loans to non-banking finance corporations, which in turn extend personal loans), the RBI put in measures to slow this growth.[8] The effect can be seen in Chart 3 above: the runaway growth of personal loans flattened between 2024 and 2025.[9] Since personal loans had been powering the overall growth of bank lending, that growth itself slowed sharply.[10]
2. Microfinance: preying on distress
While the RBI stepped in to slow the growth of personal loans, it did not (and could not) address the cause of the steep rise in personal loans, namely the low incomes and consequent distress of large numbers of households. The RBI’s interventions were aimed merely at maintaining the financial stability of the banks and the financial system, not relieving the distress of households.
On the other hand, the RBI does bear direct responsibility for the rapid growth of predatory microfinance from 2022. To understand why we term microfinance ‘predatory’, we need only recall the microfinance crisis of 2009-10, which resulted in mass distress, a number of suicides, and a protest movement in Andhra Pradesh. In its wake, the RBI was forced to place a number of restrictions on microfinance institutions (MFIs) to prevent the abuses which had led to the crisis. These included absolute restrictions on the following: the size of the loan, the total indebtedness of a single borrower, the number of MFIs who could lend to a single borrower, and the interest rates chargeable on MFI loans. Microfinance loans were to be collateral-free, with at least 50 per cent toward income-generating activities. Restrictions were put on house visits by MFI collection agents, in order to prevent the type of harassment witnessed in Andhra Pradesh.[11]
MFIs did violate these protections frequently over the years, preying on distress to expand their business.[12] Nevertheless, the MFIs chafed against these protections, and kept up relentless pressure to have them scrapped. The Covid crisis, and the widespread financial distress of households, provided the needed pretext for a renewed attack on MFI regulations. As millions lost their livelihoods in the lockdown, the RBI actively promoted microfinance as an anti-poverty measure. In the glowing words of a June 2021 RBI paper, microfinance
is an economic tool designed to promote financial inclusion which enables the poor and low-income households to come out of poverty, increase their income levels and improve overall living standards. It can facilitate achievement of national policies that target poverty reduction, women empowerment, assistance to vulnerable groups, and improvement in the standards of living.[13]
In order to promote MFIs, the RBI required in December 2021 that banks accessing specific low-interest funds from the RBI channel a share of these funds to MFIs.[14] In March 2022, it relaxed most of the restrictions placed in 2011, including the cap on interest rates, the limits on individual loans, the bar on home visits by recovery agents, and so on.
The RBI’s Financial Stability Report reports that NBFCs, including microfinance NBFCs, account for 84 per cent of personal loans below Rs 50,000 (note: this does not include loans extended by ‘non-institutional’ lenders such as traditional moneylenders). Around 10 per cent of those who had taken a personal loan under Rs 50,000 from an NBFC were overdue on their payments. Moreover a little over two-thirds of such borrowers in the last quarter had more than three live loans at the time of obtaining the loan. The share of ‘stressed assets’ (i.e., loans on which payments are overdue) of NBFCs has been rising, and the write-offs appear alarmingly high.[15]
The microfinance sector claims to lend to almost 80 million persons throughout India, with credit outstanding of about Rs 4 trillion ($45 billion), or about Rs 50,000 per borrower. According to the Microfinance Industry Network (MFIN), MFIs lend at interest rates averaging nearly 24 per cent per year.[16] MFIN presents an elaborate justification for firms charging these usurious interest rates, claiming their costs are very high.[17] However, MFIs’ profitability, as measured by return on assets, far outstrips that of the banking sector (see Chart 7), belying the RBI’s claim that it is an economic tool to end poverty.
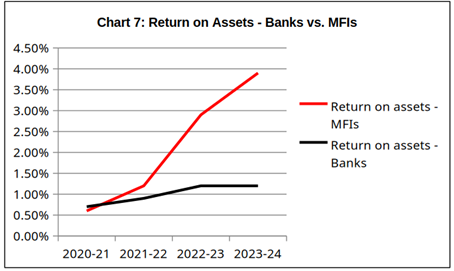
Source: For banks – RBI, Trend & Progress of Banking in India, 2021-22, 2022-23, 2023-24. For MFIs – MFIN, Micro Matters: Macro View, India Microfinance Review, 2022-23, 2023-24.
A group of scholars carried out a detailed survey and study of villages in northeastern Tamil Nadu, providing a ground-level picture of MFI operations. They found that, in the wake of the Covid lockdown, poorer households had to borrow to buy food and pay for healthcare. In the case of almost half the loans, part of the loan was used to pay off past debts; in the case of women belonging to oppressed castes, almost 80 per cent of the loan was used for this purpose. The poorer the social segment, the greater was the need to borrow: in the surveyed villages, close to 70 per cent of oppressed caste households and 40 per cent of women from intermediate caste households had taken microfinance loans, compared with only 16 per cent of dominant caste households. Debt, as a ratio of annual income, “stood at 179 per cent on average, and is higher for lowered caste and landless households, at 210 per cent and 190 per cent. This means that household debt was twice as much as annual income, while debts are short-term and must be repaid within the year for the most part.”[18]
MFI loans are not taken for productive purposes (as can be seen from their size), but in general for consumption. Hence the loans do not lead to fresh income generation with which to service such high-interest rate loans. MFI borrowers often take consumption loans precisely when their incomes are insufficient to meet their basic needs; that is, distress is a ‘growth driver’ of the industry. In the post-Covid period, MFIs stepped up their lending in low-income regions of India in which they were not active previously. Between 2020-21 and 2023-24, micro-lending in Bihar, Jharkhand and U.P. is reported to have grown at compound annual growth rates of 36 per cent, 29 per cent and 46 per cent respectively, compared to the overall industry growth of 19 per cent during the period. In addition, the loan outstanding per borrower has been increasing in these states. As a ratio of the per capita income of these states, the loan outstanding per borrower was over 50 per cent in U.P. and Jharkhand, and around 100 per cent in Bihar, much higher than in other states.[19]
MFIs’ return on assets peaked in 2023-24; it is expected to have dipped to (a still handsome) 2.5-2.7 per cent in 2024-25.[20] However, there is now clearly a crisis in the sector, with large numbers of borrowers finding themselves unable to service the loans. Chart 8 shows a steep rise in the percentage of ‘stressed’ loans in the second half of 2024. However, the situation may be even graver than the chart depicts: A Bloomberg columnist reports that “Subprime loans in India are teetering on the edge of a fresh crisis, with surveys showing signs of distress among 68% of borrowers.”[21]
Chart 8: Stressed Loans in the Microfinance Sector
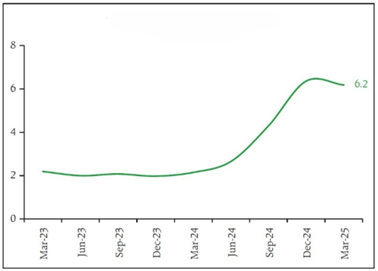
[31-180 days past due (%)]
Source: RBI, Financial Stability Report, June 2025
As the crisis broke, MFIs drastically cut back on lending in the latter half of 2024-25 (in the RBI’s words, “lenders exercised prudence in response to the stress in the portfolio”), as shown in Chart 9.
Chart 9: Credit Growth of Microfinance Institutions
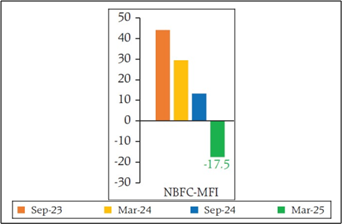
(%, year-on-year)
Source: RBI, Financial Stability Report, June 2025.
The very practices that led to the crisis of 2009-10 in A.P. appear to be once again rife. Borrowers told surveyors in the Tamil Nadu study cited above:
The microfinance loan officers are threatening us, saying that they will call the police and file cases against us, that they will seal our houses and prevent us from entering them, that they will lock our Aadhaar cards. Not only will we be denied loans from other companies and banks, the rice and dal we get every month from the ration shop will also be blocked… [L]oan officers would insist on repayment even if there was a death in the family. Amudha Mary, a Dalit Christian woman from Selvanagar told us: “They collect their money over the corpse, saying ‘first you pay this and then you cry’.”[22]
In Karnataka, where the MFI industry grew 32 per cent in 2023-24 over the previous year, similar tales of distress and harassment have been widely reported,[23] leading to the state assembly passing the Karnataka Micro Loan and Small Loan (Prevention of Coercive Actions) Act, 2025. The Tamil Nadu assembly has similarly passed the Tamil Nadu Money Lending Entities (Prevention of Coercive Actions) Act, 2025.
The microfinance sector appears to follow a cycle of steep growth of predatory lending, mass distress, crisis, and post-crisis regulatory action. The cycle may be repeated after an interval.
3. Dependence on informal lenders
There are also indications that households have increased their borrowings from moneylenders in the recent period (the terms used in the literature are ‘non-institutional’ or ‘informal’ lenders; banks and NBFCs, including MFIs and digital lenders, are classified as ‘institutional’ or ‘formal’ lenders). Indebtedness to informal lenders in India has long been underestimated in official surveys. It appears households prefer not to reveal such information to official surveyors, perhaps out of apprehensions or because indebtedness is seen in Indian society as a matter of shame.
Data from official and private surveys indicate that four-fifths of rural households had no outstanding loan to formal sector lenders. Whereas official surveys show incidence of rural indebtedness at between 20 and 30 per cent in most states, reliable independent village surveys show debt incidence ranging between 50 and 75 per cent; much of the gap may be accounted for by informal lenders.[24]
Indeed, a number of other rural surveys have found that the incidence of household debt to the non-institutional/informal sector is greater than that to the institutional/formal sector.[25] This is also reflected in the World Bank’s Global Findex survey, which allows one to compare the numbers of persons who have taken a loan of any type with the numbers who have taken a loan from the formal sector (see Chart 10 below). The difference is accounted for by the informal sector, including both family/friends and moneylenders.[26] (The data in Chart 10 refer to all adults, rural and urban. The corresponding figures for rural adults in 2024 are as follows: 65.8 per cent borrowed money; 15.2 per cent borrowed from formal lenders.)
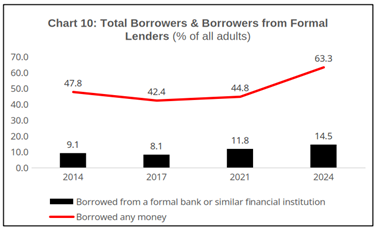
Source: 2024 Global Findex data, World Bank. The survey is of rural adults (15+ years). Formal sources here include banks, credit cooperatives, microfinance institutions, and post offices. See footnote 26.
The more socially oppressed sections are more dependent on informal sector loans, and this dependence has been increasing. The share of debt of Dalit households from commercial banks fell sharply during the period of post-1991 ‘liberalisation’; “The vacuum thus created was filled in by professional moneylenders. While professional moneylenders did emerge in 2002 as an important source of credit for other rural households as well, their hold over Dalit households was much stronger. The expansion of informal debt meant an increased and onerous interest burden on rural Dalit households.”[27]
Similarly, dependence on informal lenders is particularly acute among rural landless households, as depicted in Chart 11 below.
Chart 11: Composition of Outstanding Loans of Rural Landless Households (%)
Source: RBI, Currency & Finance Report, 2023-24, based on National Sample Survey 77th Round, 2019. The data refer to rural households with less than 0.01 hectares of land.
The weighted average interest rate on informal loans is found to be 30 and 30.5 per cent for rural and urban households, respectively.[28] Thus the section which is in the most dire economic need, and borrows for mere subsistence, pays the highest interest rates.
Growing share of informal lenders during period of distress
During a period of large-scale economic distress, debt to informal lenders would tend to rise, since these lenders are easily accessible (physically and culturally) to the rural poor; they supply loans quickly; and they require little or no documentation from borrowers. Indeed, there is evidence of this.
A study by Piramal Finance, using data from the large-sample household survey carried out by the Centre for Monitoring the Indian Economy, looks at the change in the composition of household debt in the period 2019-23.[29] Dividing households into four categories by income, the study shows that (1) the poorest segment has reduced its borrowing from the institutional sector and increased its borrowing from non-institutional lenders; (2) the next two segments have increased their borrowing from both, but more from the non-institutional lenders; (3) households with an income of over Rs 10 lakh have reduced their borrowing from both types of lenders. The study also segments borrowers by employment, and finds that the largest rise in non-institutional loans is among wage labourers and ‘self-employed entrepreneurs’ (such as petty vendors, tradesmen, cobblers, artisans, and so on).
Chart 12: Compound Annual Growth Rate of Borrowings According to Income Groups,
2018-19 to 2022-23
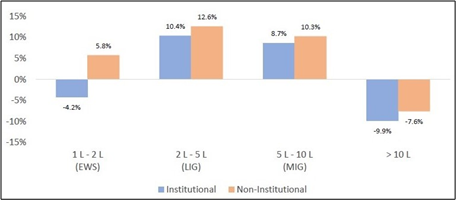
Source: Chaudhuri et al., op. cit., on the basis of the CMIE Consumer Pyramid Household Survey.
The study, it should be noted, is motivated by the interests of Piramal Finance, an NBFC engaged in retail lending: It portrays the NBFCs as saviours of the poor, who would otherwise be left to the clutches of the moneylenders. It concludes with a wish list of measures for the promotion of NBFCs. Nevertheless, its findings regarding the growth of dependence on the informal sector are valid, and are anecdotally confirmed by a number of media reports.
4. Borrowing against gold jewellery
Finally, there has been a steep rise in borrowing by households against gold, from both banks and NBFCs. Since the RBI in November 2023 instituted certain measures to slow the growth of banks’ unsecured personal loans, banks have been aggressively expanding their loans against gold, which are fully secured. (Here we are discussing only banks’ personal loans against gold, and not bank’s agricultural loans against gold. The latter account for about four-fifths of total gold loans by banks.) In 2024-25 banks’ gold loans doubled over the previous year, while NBFCs’ gold loans remained at about the previous year’s level.
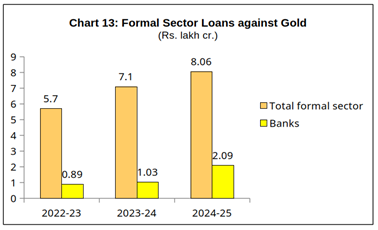
Source: For banks: RBI, Sectoral Deployment of Non-Food Gross Bank Credit. For total formal sector: PwC (see footnote 30). Note: The figure for the total formal sector for the year 2024-25 is a PwC projection.
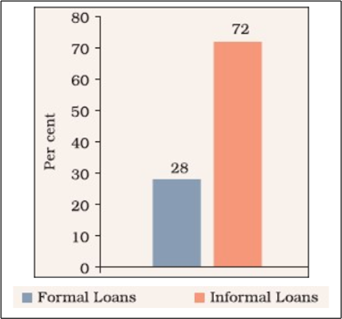
According to an August 2024 report by the global consulting firm PwC, informal lenders (traditional moneylenders) account for 63 per cent of the gold loan market, with formal lenders (banks and NBFCs) accounting for the remaining 37 per cent. Of the formal sector market, banks accounted for 14 per cent and NBFCs accounted for 23 per cent, as of September 2023; however, as the share of banks has been rising sharply, the above percentages would have shifted thereafter.
PwC estimates that Indian households own an estimated Rs 126 lakh crore worth of gold, whereas the formal gold loan market was only Rs 7.1 lakh crore in 2023-24. In its view, “This indicates that there is a huge potential to be unearthed in household gold which can create a larger market for penetration of gold loans.” Thus the title of its report on the subject: Striking Gold.[30]
PwC does concede that there is “a social stigma associated with taking out loans in many communities in India” and “the stigma intensifies when the loan is secured by pledging personal gold ornaments, or those that have been passed down through many generations in Indian families.” Thus only poorer households, who do not have easy access to credit, would pledge gold for a loan; and it is only at times of distress and emergency that they would do so. This is perhaps what PwC is referring to when it says that “gold loans have been instrumental in promoting financial inclusion in India”.
The rich do not take microfinance loans, loans from informal lenders, or gold loans. Indeed the entire phenomenon of growing household debt we have described above – whether from banks, NBFCs, or the informal sector – takes place at the bottom of the income pyramid. These are not loans taken for buying expensive flats and cars, but for subsistence needs, out of distress. They indicate that the incomes of vast numbers of labouring people are insufficient for subsistence.
While loans may be taken for subsistence needs, they do not really boost demand; for debts must be serviced, and debt servicing payments reduce the portion of household income available for purchasing goods.
Notes
- Essential items are defined as comprising food, housing, fuel and electricity, essential clothing, education, medical amenities, transportation etc. Non-essential items are defined as comprising consumer durables, motor vehicles, gold and jewellery, expenses on hotels and restaurants, etc. ︎
- For example, Questions 6_1 and 6_2 try to pinpoint the reasons for the increased/reduced spending by the respondents. No data of these responses are released by the RBI. ︎
- They are not to be found in the RBI press release of the surveys, the Excel files of the compiled responses, or the unit-level data released by it. ︎
- See Prabhat Patnaik, “Macroeconomics of a Lockdown”, Economic & Political Weekly, September 19, 2020. ︎
- Bank for International Settlements (BIS) estimates show India’s household debt/GDP rising from 35.7 per cent of GDP in March 2020 to 41.9 per cent in December 2024. National income data show financial liabilities of households rising from 3.9 per cent in 2019-20 to 6.4 per cent in 2023-24. ︎
- Ministry of Finance, tweet, September 21, 2023, https://x.com/FinMinIndia/status/1704742328077107244 ︎
- RBI, Financial Stability Report, June 2025, p. 33. ︎
- It raised the risk weight on such loans, which makes them less attractive for banks. ︎
- During September 2021-September 2023, banks’ unsecured retail loans grew at the compound annual rate of 27 per cent, and bank lending to NBFCs at the rate of 28.7 per cent. These fell to 11.6 per cent and 8.8 per cent, respectively, in the period September 2023-March 2025. ︎
- The RBI also restrained bank lending to non-banking financial corporations (NBFCs) that in turn extended personal loans. ︎
- In the wake of the 2009-10 Andhra Pradesh microfinance crisis, suicides and mass protests, the RBI was forced to set up the Malegam Committee, and on the basis of its recommendations introduce a regulatory framework foon December 2, 2011. Some of the features of this framework are listed below. In the wake of the 2009-10 Andhra Pradesh microfinance crisis, suicides and mass protests, the RBI was forced to set up the Malegam Committee, and on the basis of its recommendations introduce a regulatory framework foon December 2, 2011. Some of the features of this framework are listed below.
Criteria for MFI loans:
(i) They were to be disbursed to a borrower with household annual income not exceeding ₹1,25,000 and ₹2,00,000 for rural and urban/semi-urban households respectively;
(ii) Loan amount should not exceed ₹75,000 in the first cycle and ₹1,25,000 in subsequent cycles;
(iii) Total indebtedness of the borrower should not exceed ₹1,25,000 (excluding loan for education and medical expenses);
(iv) Minimum tenure of 24 months for loan amount exceeding ₹30,000;
(v) Collateral free loans without any prepayment penalty;
(vi) Minimum 50 per cent of aggregate amount of loans for income generation activities;
(vii) Flexibility of repayment periodicity (weekly, fortnightly or monthly) at borrower’s choice.
Pricing:
NBFC-MFIs were required to comply with the following norms for pricing of microfinance loans:
(i) They were permitted to charge only three components viz., interest charge, processing fees (limit of 1 per cent of gross loan amount) and insurance premium on actual basis.
(ii) Interest rate should be lower of –
a) cost of funds plus margin of 10 per cent for NBFC-MFIs with loan portfolio exceeding ₹100 crore and 12 per cent for others;
b) 2.75 times of the average base rate of the five largest commercial banks.
Other Customer Protection Measures
(i) Not more than two NBFC-MFIs could lend to the same borrower.
(ii) No security deposit/ margin was to be collected from the borrower.
(iii) There was to be no penalty charged on delayed payment.
(iv) All sanctions and disbursement of loans were to be done only at a central location.
(v) Recovery was normally to be made only at a central designated place. Field staff would be allowed to make recovery at the place of residence or work of the borrower only if borrower fails to appear at the central designated place on two or more successive occasions.
— RBI Department of Regulation, “Consultative Document on Regulation of Microfinance”, June 14, 2021. ︎
- Chander Suta Dogra, “Why Microfinance Is Becoming a Bad Word All Over Again”, The Wire, January 15, 2016. ︎
- RBI Department of Regulation, “Consultative Document on Regulation of Microfinance”, June 14, 2021. ︎
- Under the Targeted Long Term Repo Operations 2.0 scheme, the RBI extended funds at 4 per cent per annum to banks with the stipulation that at least 50 per cent of the funds had to be deployed in specified securities of small NBFCs and MFIs. ︎
- On an annualised basis, the FSR puts write-offs for all NBFCs in the March 2025 quarter at 46.4 per cent; for Upper Layer NBFCs the figure is 72.9 per cent. ︎
- Microfinance Industry Network (MFIN), Micro Matters: Macro View, India Microfinance Review, FY2023-24, December 2024, p. 61. ︎
- Ibid. ︎
- Nithya Joseph, Venkatasubramanian Govindan, Isabelle Guerin and Sebastien Michiels, “How Microfinance and Data Capture Pushed Tamil Nadu’s Most Disadvantaged Into Debt Distress”, The Wire, December 18, 2024. https://thewire.in/business/microfinance-data-capture-tamil-nadus-debt-distress ︎
- ICRA, “Evolving asset quality risks to impact growth and profitability of microfinance: ICRA”, September 3, 2024. ︎
- Ibid. ︎
- Andy Mukherjee, “India’s Subprime Bubble Grew 2,100%. Now a Bust Looms.”, Bloomberg, April 4, 2025. ︎
- Nithya Joseph et al., op. cit. ︎
- Sharath S. Srivatsa, “The huge burden of small loans in Karnataka”, The Hindu, April 17, 2025. ︎
- Pallavi Chavan, “Debt of Rural Households in India: A Note on the All India Debt and Investment Survey”, Review of Agrarian Studies, January-June 2012. ︎
- For example, H. S. Shergill, Rural Credit and Indebtedness in Punjab, Institute for Development and Communication, 1998; Anita Gill, Lakhwinder Singh, “Farmers’ Suicides and Response of Public Policy”, Economic and Political Weekly, June 30, 2006; N. Shyam Sundar, “Nature of Rural Credit Markets: An Investigation of Eight Villages in A.P.”, and R.S. Rao and M. Bharathi, “Comprehensive Study on Land and Poverty in Andhra Pradesh: A Preliminary Report”, 2003, cited in the Report of the Commission on Farmers’ Welfare, Government of Andhra Pradesh, 2004; Report of the Farmers’ Commission of Experts on Agriculture in Andhra Pradesh, 2002. Priya Basu, Improving Access to Finance for India’s Poor, World Bank, 2006, reports the findings of a World Bank-NCAER survey which found that 40 per cent of rural households had an outstanding loan to informal lenders, compared to 21 per cent from formal lenders. ︎
- See Figure 4 of Pallavi Chavan and Ashish Kamra, “Financial Inclusion in Rural India: An Assessment Based on Secondary Data”, Review of Agrarian Studies, July-December 2022, based on World Bank, Global Findex database. Chavan and Kamra provide data of rural borrowers up to 2021; Chart 10 of this article provides data of all borrowers (rural+urban) up to 2024. ︎
- Pallavi Chavan, “The Access of Dalit Borrowers in India’s Rural Areas to Bank Credit”, Review of Agrarian Studies, July-December 2012. ︎
- K.G.K. Subba Rao, “Interest Rates in Informal Credit Markets and Their Impact on National Accounts,” Economic & Political Weekly, June 4 and July 1, 2023. ︎
- Debopam Chaudhuri, Arka Chatterji, Tanya Agrawal, and Surbi Mantri, “Prevalence of Non-Institutional Borrowings among Indian Households: A Pre and Post COVID-19 Analysis”, Piramal Finance. ︎
- PwC, Striking Gold: The rise of India’s gold loan market, August 2024. ︎
[Courtesy: Research Unit for Political Economy (RUPE), a Mumbai based trust that analyses economic issues for the common people in simple language.]