[This article is a part of a series of articles on ‘India’s Education Journey: From Macaulay to NEP’. This is the eighth part of this series. The previous articles have been published in previous issues of Janata Weekly.]
NEP-2020 on Higher Education
The Modi Government’s National Education Policy (NEP-2020) places great emphasis on developing “quality higher education” whose purpose is “more than the creation of greater opportunities for individual employment” (Section 9.1.3). It emphasises the important role of higher education in promoting societal well-being, Constitutional values, scientific temper, creativity, spirit of service and 21st-century capabilities (Sections 9.1 and 9.1.1). It seeks “to develop all capacities of human beings” (Section 11.3). To realise these goals, the higher education system must be “multidisciplinary”, engage in “high quality teaching and research” (Section 10.14), and most importantly, must have “motivated, energised and capable faculty” (Section 13). NEP also promises to create “outstanding public institutions” alongside private ones, backed by adequate public funding (Section 10.9).[56]
But it is silent about the biggest problem plaguing our higher education system: lack of adequate public funding to realise these goals. While NEP-2020 claims public institutions will receive sufficient financial support (Section 10.11),[57] the reality, five years since its launch, tells a different story.
Budget Allocation for Higher Education
The budgetary allocation for higher education over the 12 Modi budgets from 2014–15 A to 2025–26 BE has grown at a modest CAGR of 7.3 percent—barely keeping pace with inflation (Table 4.2).
Table 4.2: Higher Education Budget, FY15 and FY26 (Rs. crore)
| 2014–15 A (1) | 2025–26 BE (2) | Increase, 2 over 1, % (CAGR) | |
| Department of Higher Edn. | 23,152 | 50,078 | 7.27 |
Worse, nearly three-quarters (74 percent) of this limited budget for 2025–26 BE has been allocated to a handful of elite institutions like the IITs, IIMs, IISERs, NITs, IIITs, IISc and Central Universities (Table 4.3).
Table 4.3: Allocation for Elite HEIs vs Ordinary HEIs, 2025–26 BE (Rs. crore)
| Elite HEIs | Ordinary HEIs | ||
| Budget | Budget | ||
| IITs, IIMs, NIT, IIEST, IISERs, IISc, IIITs | 20,063 | UGC | 3,336 |
| Central Universities | 16,691 | AICTE | 200 |
| Setting up World Class Institutions | 475 | RUSA | 1,815 |
| Total: Elite HEIs (1) | 37,229 | Total: Ordinary HEIs (2) | 5,351 |
| (1) as % of Higher Education budget | 74.3% | (2) as % of Higher Education budget | 10.7% |
As a result, very little budget is left for the vast majority of ordinary colleges, which serve the majority of the higher education students (Table 4.3):
- Allocation for the UGC, which regulates higher educational institutions in the country and provides grants to more than 20,000 colleges and several hundred universities, has been slashed by 62 percent, from Rs. 8,906 crore in 2014–15 A to Rs. 3,336 crore in 2025–26 BE.
- AICTE, the regulator of engineering education in India, received just Rs. 200 crore in 2025–26 BE.
- Rashtriya Uchha Shiksha Abhiyan (RUSA), the Central scheme for providing aid to State higher and technical institutions to enhance quality, saw its spending plummet to just Rs. 186 crore in 2023–24 A. (While the 2025–26 BE shows a significant increase, past trends suggest that actual spending is likely to fall far short of the allocation.)
With such tiny allocations for the UGC, AICTE and RUSA, most government-funded colleges are starved of funds and so are being forced to raise student fees to survive, making public higher education increasingly unaffordable for students from poor families.
These funding cuts expose the NEP’s assurances as mere rhetoric. In reality, the Modi Government has accelerated the neoliberal agenda in education being pursued since the 1990s, and is now pushing all government HEIs to become fully financially autonomous.
The NEP-2020 also proposes the gradual phasing out of single-stream HEIs and the merger of nearby colleges into cluster universities over the next 15 years (Sections 10.1 and 10.11).[58] This implies that the total number of government-funded colleges is going to decline in the coming years, and those that survive will be transformed into self-funded cluster universities—public institutions only in name.
Accelerated Privatisation of HEIs
Building on the recommendations of the Ambani–Birla and NKC reports, NEP-2020 is the first education policy to explicitly endorse private sector entry into higher education. It does so under the guise of encouraging “philanthropic and public-spirited” institutions (Section 18.14). It asserts that public and private HEIs will be treated on par (Section 18.13). It allows these private HEIs to generate “surpluses” by giving them full freedom to set fees and staff salaries (Sections 18.12 and 18.14).[59]
Along with sharp cuts in public funding, this has created favourable conditions for further privatisation of higher education. According to the All India Survey on Higher Education (AISHE) 2021–22 (released in January 2024):
- 65.3 percent of all colleges and 40.4 percent of universities are private unaided;
- Together, these private unaided institutions form 64.6 percent of HEIs, up from 62.4 percent in 2014–15;
- Despite this, government HEIs still enrolled more students (1.77 crore or 44.2 percent) than private unaided HEIs (1.6 crore or 40.5 percent)—due to lower fees (Chart 4.7).
Chart 4.7: Distribution of HEIs and Student Enrolment in HEIs*, by Management
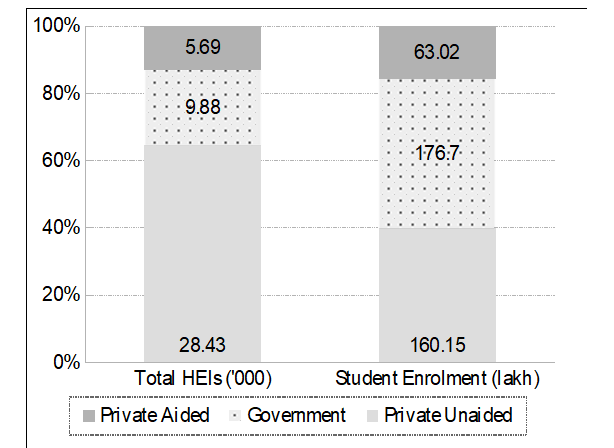
* Data excludes Stand alone institutions
Data source: Our calculations, based on data given in: All India Survey on Higher Education (AISHE) 2021–22, Department of Higher Education, New Delhi, https://cdnbbsr.s3waas.gov.in. In this data, we have excluded stand alone institutions. This category includes institutions like polytechnics, teacher training institutes, nursing institutes, etc.; while they account for 20.5 percent of all HEIs, they account for only 5 percent of total student enrolment. AISHE does not give the breakup of student enrolment in stand alone institutions. The data also does not include those colleges and universities that did not respond to the survey. Of the total 1,168 universities, 1,162 responded to the survey, and of the total 45,473 colleges, 42,825 responded.
Contractualisation of Teachers
A core aspect of the neoliberal agenda is casualisation of the workforce, to boost corporate profits. This is now being extended to the education sector. Both public and private HEIs are slashing permanent teaching posts and replacing them with ad hoc staff.
The UGC maintains no official data on vacancies or contract appointments. News reports suggest even elite Central HEIs like IITs and Central Universities face around 50 percent faculty shortages.[60] State-funded HEIs are worse off—it is estimated that about 60–70 percent of teachers in Karnataka and probably an equal number in Bihar are temporary.[61] And private HEIs, by their very structure, do not offer permanent teaching posts.
As discussed earlier, NEP quietly undermines reservations in faculty hiring and promotion. This is particularly evident in higher education. While private HEIs—now the majority—are not bound by reservation policies, even in government HEIs many reserved posts remain vacant. The Hindu reports that IITs and IIMs continue to be dominated by faculty from the General category, ignoring government-mandated reservations for SC, ST and OBC groups.[62]
Quality by the Wayside
With higher education institutions sprouting all over the country like mushrooms, to ensure standards, the government established the National Assessment and Accreditation Council (NAAC) in 1994 to evaluate and accredit HEIs. However, accreditation is mandatory only for institutions receiving UGC grants.[63] Most newly opened private self-financing HEIs, lacking adequate infrastructure and faculty, prefer not to seek accreditation.
As of August 2023, only 441 universities and 9,413 colleges were NAAC-accredited, with just 245 universities and 1,964 colleges earning an A grade.[64] According to AISHE 2021–22, India had 1,168 universities and 45,473 colleges in 2021–22. It is likely that colleges and universities not accredited by NAAC are below average, which is why they have avoided accreditation. This means:
- 64 percent of the universities and 82 percent of all colleges in the country are of below average standard;
- Only 21 percent of all universities and 4.3 percent of all colleges are top grade (graded A by NAAC) (see Chart 4.8).
Chart 4.8: HEIs Accredited by NAAC
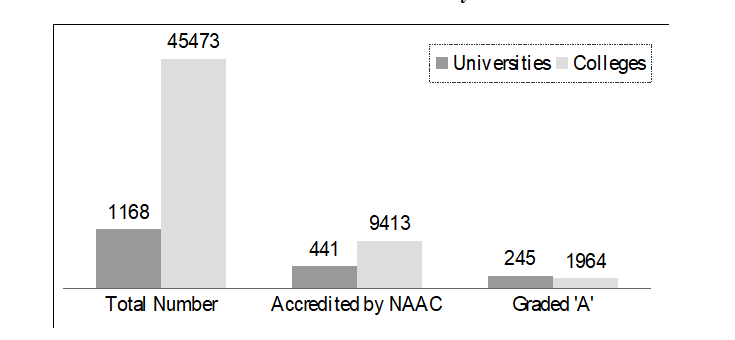
Source: Our calculation, based on NAAC and AISHE data. 245 universities had received A grade out of 1,168 universities = 21 percent; 1964 colleges had received A grade out of 45,473 colleges = 4.3 percent. 17 universities had received C grade; 727 universities have avoided accreditation; so assuming these are also below average, total universities below average = 727 + 17 = 744 or 64 percent of total universities. 1,159 colleges have received C grade; 36,060 colleges have avoided accreditation, so assuming these are also below average, total colleges below average = 36060 + 1159 = 37219 or 82 percent of total colleges.
The Centralised Exams Swindle
The Modi Government is seeking to tighten its control over the entire higher education system in the country—undermining federalism and the Constitutional principle of education as a concurrent subject—by pushing for centralised admission tests at the national level, for which it has set up a National Testing Agency (NTA). The NEP-2020 also endorses this. The NTA has started holding centralised entrance examinations, including the National Eligibility cum Entrance Test (NEET) for undergraduate medical admissions and the Common University Entrance Test (CUET) for admission to all 45 central universities. The NEP, senior government functionaries and leading academics claim this will provide a level playing field for students from diverse backgrounds and boards, standardise merit and reduce the burden on students and universities.
However, far from creating equality, such centralised admission exams favour students from urban, affluent, and English-educated families—especially those who can afford expensive private coaching. On the other hand, they severely disadvantage students from rural areas, government schools and marginalised communities—particularly SC, ST and OBC students—who lack access to the ecosystem of elite coaching and privileged schooling.
This was the central finding of the Justice A.K. Rajan Committee, set up by the Tamil Nadu Government in 2021 to examine the impact of NEET on medical admissions in the State. The committee’s data-driven investigation revealed that NEET had led to a sharp decline in the share of students from government schools, backward communities and rural backgrounds in medical colleges. It concluded that NEET had effectively dismantled the State’s inclusive admission system based on Class 12 board marks.
NEET has not democratised opportunity—it has commodified it. The Rajan Committee found that over 99 percent of students who secured admission had undergone private coaching. Since NEET was introduced in 2016, more than 400 coaching centres had mushroomed in Tamil Nadu alone, generating a staggering Rs. 5,750 crore business. These centres charge exorbitant fees, pushing medical education even further out of reach for disadvantaged families. For most students, success is no longer about merit—it’s about the ability to pay. The Rajan Committee emphatically recommended:
NEET is not a fair or equitable method of admission to medical colleges and should be permanently scrapped in Tamil Nadu in favour of a Class 12 marks-based admission system that promotes social equity and inclusiveness.[65]
The same warning applies to CUET, which now threatens to replicate NEET’s harmful effects across the entire university system.
Reduction in Scholarships
Since private HEIs operate for profit, they are unaffordable for most students. But now even government HEIs are becoming inaccessible to poor students, as government funding declines and fees rise sharply.
In such circumstances, scholarships are essential to ensuring access to higher education for students from low-income families. However, the Modi Government has steadily cut funding for scholarships for SC/ST/OBC, minority, women and other marginalised groups. In the higher education budget, this support appears under ‘Student Financial Aid’. Allocations for this have fluctuated—from Rs. 1,737 crore in 2014–15 A and Rs. 2,177 crore in 2015–16 A, to Rs. 1,872 crore in 2021–22 A and Rs. 1,603 crore in 2022–23 A. But within this, the allocation for scholarships is very small and has remained stagnant at around Rs. 200 crore. Most of the financial aid is being given in the form of interest subsidy on student loans.
From the 2023–24 budget, the sub-heads ‘Interest Subsidy’ and ‘Scholarships for College and University Students’ have been merged under the pretentious rubric PM Uchchatar Shiksha Protsahan (PM-USP) Yojana. We will no longer know what the allocation for scholarships is. The PM and FM can now quietly further reduce and even eliminate this allocation, and provide only an interest subsidy on education loans to students.
This concern is validated by the sharp fall in allocation for Student Financial Aid—from Rs. 1,954 crore in 2023–24 BE to Rs. 398 crore in actual spending. Although the 2025–26 BE has again increased it to Rs. 2,160 crore, actual spending won’t be known until two years later.
Additional scholarship schemes for higher education under the Department of Social Justice and Empowerment and the Ministry of Minority Affairs have also suffered major cuts.[66]
Such is the reality of the Modi Government’s priorities. While it spends lakhs of crores on bullet trains and multi-lane expressways, it refuses to spend even a fraction of that in ensuring a future for the country’s most vulnerable students.
Skilling, Not Higher Education, for Poor Children
Children from poor families will be hardest hit by the deep cut in funding for 99 percent of government HEIs, leading to soaring fees, privatisation and reduced scholarships. The Modi Government is effectively shutting the doors of higher education for them.
NEP-2020 has a provision that eases the exit of poor students from higher education. It proposes a shift from a 3-year to a 4-year undergraduate degree programme, increasing the cost of completing the degree course. Simultaneously, it allows students to exit after 1, 2 or 3 years with a certificate indicating the duration of their study (Section 11.9),[67]—which, given the high unemployment, will have little value in the job market.
Under the prevailing neoliberal philosophy, the poor are seen as tools for corporate profit. Therefore, there is no need to provide higher education to children from the marginalised groups—Dalits, Adivasis, girls, minorities, small farmers and workers. They must only be given the necessary skills—so that they can join the assembly lines of corporate houses. NEP-2020, therefore, pushes those unable to access formal education into vocational training. It even sets a target: By 2025, at least 50 percent of learners in school and higher education will have exposure to vocational education, for which it calls for integration of vocational education into all educational institutions over the next decade (Sections 16.5 and 16.6).[68]
To further this, the government has created a dedicated ministry: the Ministry of Skill Development and Entrepreneurship (MSDE). Since its launch in 2015, its budget has grown sixfold (Table 4.4). It was supposed to skill 40 crore workers by 2022.[69] But Pradhan Mantri Kaushal Vikas Yojana (the flagship programme of the MSDE) data reveals that since its inception, the program has so far enrolled only 1.43 crore youth, of whom 1.1 crore passed the required assessments and became certified, and just 21.8 lakh secured jobs.[70]
Table 4.4: Budget Allocations for Skill Development (Rs. crore)
| 2015–16 A | 2024–25 RE | 2025–26 BE | |
| Ministry of Skill Development | 1,007 | 3,300 | 6,100 |
An important reason for this low placement rate is the substandard quality of the courses being offered under this program. They produce only poorly trained workers, which is why their certificates carry little value in the labour market.[71] But beyond this, the deeper problem is the acute shortage of jobs—India is grappling with a severe employment crisis.[72]
Budget 2024: More Skilling
Despite poor outcomes of this skilling program, the 2024 budget announced a new goal: to skill 20 lakh youth over the next five years. For this, 1,000 Industrial Training Institutes (ITIs) are to be upgraded, for which the Centre pledged to spend Rs. 30,000 crore (Rs. 6,000 crore per year). However, only Rs. 1,000 was allocated in the 2024 budget, of which just Rs. 294 crore was spent (RE). This year, the allocation has been increased to Rs. 3,000 crore. This half-hearted funding suggests that even the Finance Minister is aware of the limitations of her employment generation programme.
In the 2025 budget, the FM announced five National Centres of Excellence to skill youth for “Make for India, Make for the World” manufacturing. But no allocation for this appears in the budget—likely just more empty talk.
NEP-2020: Commodification of Higher Education
The gradual privatisation of higher education since the 1990s, and its acceleration under the Modi regime, has transformed higher education into a commodity—something now bought and sold in the marketplace. Obviously then, like every other commodity—soap, mobile phone, cloth, TV, scooter, car—there will be good-quality and bad-quality education, depending upon the purchasing power of the consumer.
Over two-thirds of our HEIs are now private unaided institutions. The wealthy can now attend five-star private universities offering luxury amenities—shopping malls, five-star hotels, saunas, designer lounges, touchscreen classrooms and gyms. Fees are exorbitant: Rs. 50,000–3 lakh annually for BA and B.Ed. degrees, Rs. 2–5 lakh for engineering, Rs. 40–50 lakh for MBA and Rs. 1–4 crore for medical degrees.
For the poor, there are under-resourced colleges with poor facilities and under-qualified staff.
Let us examine the limited data available on how commodification is affecting access to higher education across different socio-economic groups.
i) Gross Enrolment Rate
GER in higher education (ratio of persons enrolled in HEIs to total number of persons in the age-group of 18 to 23 years) rose from 19.4 in 2010–11 and 24.3 in 2014–15 to 28.4 in 2021–22. Female GER increased from 23.2 in 2014–15 to 28.5 in 2021–22, implying that more women are now enrolled in higher education than men. However, GER for SCs was 25.9 and STs 21.2—below the national average.[73]
Despite this increase, India’s GER in higher education is way behind that of developed countries, whose GER is as high as 78–80, and is also much below that of many developing nations (Chart 4.9).
Chart 4.9: GER: India and Rest of the World, 2023
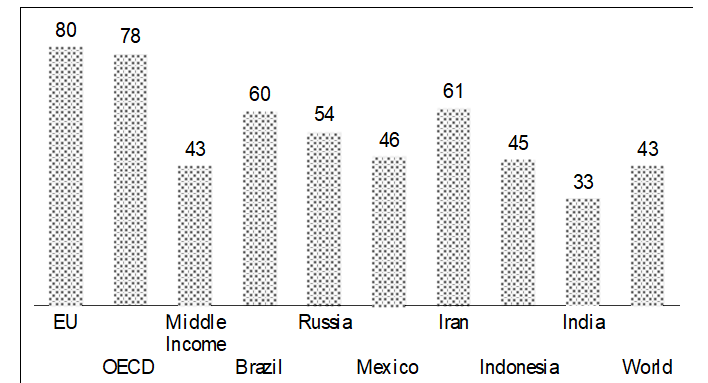
Source: School Enrollment, Tertiary (% Gross), https://data.worldbank.org, accessed on 25 July 2024. The data for India is World Bank estimate, and appears to be on the higher side, but we do not have official figures from Government of India for 2023.
ii) Gross Attendance Ratio
Averages hide disparities. The above data do not reveal the inequities in accessing higher education among students from lower socio-economic backgrounds. Unfortunately, AISHE data does not provide GER figures by income level.
Some understanding of this disparity can be drawn from NSSO surveys. Educationist J.B.G. Tilak has used data from NSSO rounds of 2007–08 and 2013–14 to estimate gross attendance ratio (GAR) in higher education across income quintiles in rural and urban areas, for both men and women.[74] GAR is a more meaningful metric than GER, as attendance is more indicative of participation than enrolment.
Chart 4.10: GAR in Higher Education by Income Quintile, Urban, Rural and All Areas (2007–08 and 2013–14)
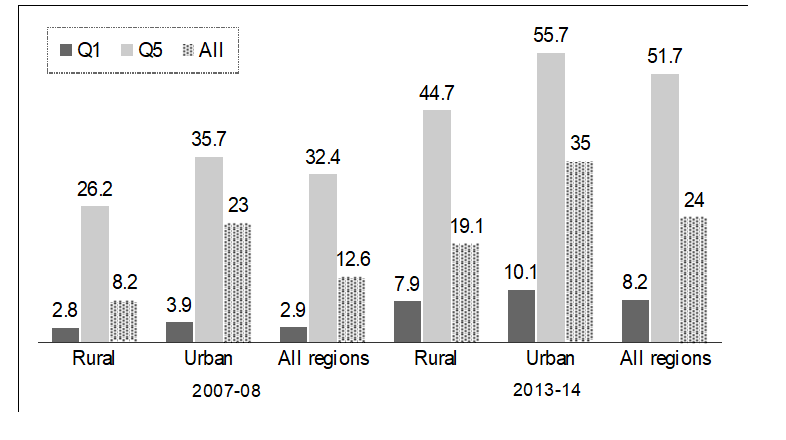
We present Tilak’s findings in Chart 4.10. Though the chart shows data only for the lowest (Q1) and highest (Q5) income quintiles, his detailed data reveal a steady increase in GAR with rising income—the wealthiest having the highest and the poorest the lowest GAR. In this chart, we have omitted data by gender, as the GAR difference between men and women within the same year, region and quintile is minimal (though inequality rose more for women over this period).
Over the six-year period 2007–08 to 2013–14, GAR in higher education nearly doubled from 12.6 percent to 24 percent. But as Chart 4.10 shows, these averages mask a sharp rise in inequality, both between income groups and between rural and urban areas:
- The GAR for the poorest families rose by 5.3 percent (2.9 to 8.2), while for the richest households it rose by 19.3 percent (32.4 to 51.7). The gap in GAR between the poorest and richest families widened from (32.4 – 2.9 =) 29.5 to (51.7 – 8.2 =) 43.5 percentage points. This means that while access to education for poorest families increased, access for richer families increased much more: inequality in access to higher education increased with households’ economic status..
- Rural-urban inequality was high. In 2013–14, average rural GAR (19.1 percent) was just over half of urban GAR (35 percent).
- While access to higher education increased in rural areas over this period, the rich–poor gap widened from (26.2 – 2.8 =) 23.4 percentage points in 2007–08 to (44.7 – 7.9 =) 36.8 in 2013–14.
- In urban areas, the gap increased even more sharply—from (35.7 – 3.9 =) 31.8 to (55.7 – 10.1 =) 45.6 percentage points .
- GAR for the richest urban quintile (55.7 percent) neared developed country levels, but for the poorest two quintiles, it was below the GER in the world’s poorest nations (Q1 = 8.2 percent, Q2 = 11.7 percent).
iii) Fall in GAR in Subsequent Years
The latest available GAR data are from the NSSO 75th round (2017–18), though it isn’t broken down by income levels—only overall averages are available. Chart 4.11 compares GAR for 2013–14 and 2017–18. It indicates a decline in GAR across all regions and for both men and women. This suggests that participation in higher education has dropped during the Modi years.
Chart 4.11: GAR in Higher Education by Gender and for Urban and Rural Regions, 2013–14 and 2017–18
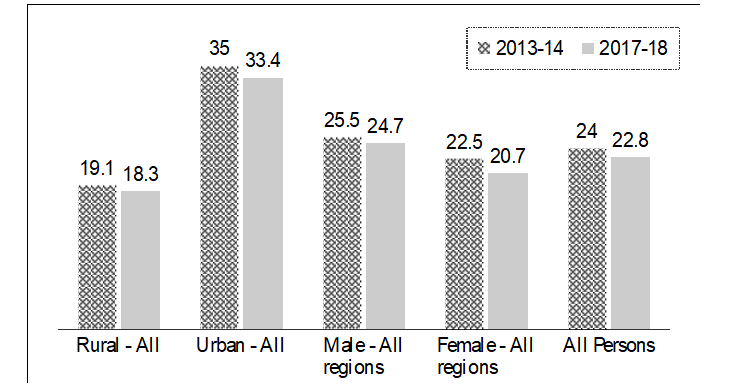
Source: Key Indicators of Household Social Consumption on Education in India, NSS 75th Round, July 2017–June 2018, MoSPI, https://www.thehinducentre.com.
On the other hand, AISHE reports show that GER increased over this period (from 23.0 in 2013–14 to 25.8 in 2017–18). However, as explained earlier, GER data are based on administrative records and tend to overstate the situation.
After this, NSSO surveys have stopped releasing GAR data. This absence raises the serious question: Is the government trying to suppress evidence of declining access to higher education, especially for the poor and marginalised?
iv) Higher Education Completion
A major limitation of GER and GAR as indicators of higher education growth is that they do not account for completion—many students who enrol in college, and even attend college for a short while, often drop out before completing the course, likely due to financial constraints. The most reliable metric for assessing the status of higher education is the higher education completion rate (also called attainment rate)—the percentage of adults (above 15 years of age) who have completed at least a graduation degree. Chart 4.12 presents this data across income quintiles, rural/urban areas and gender.
Chart 4.12: Higher Education Attainment by Consumption Quintile, Region and Gender, 2013–14
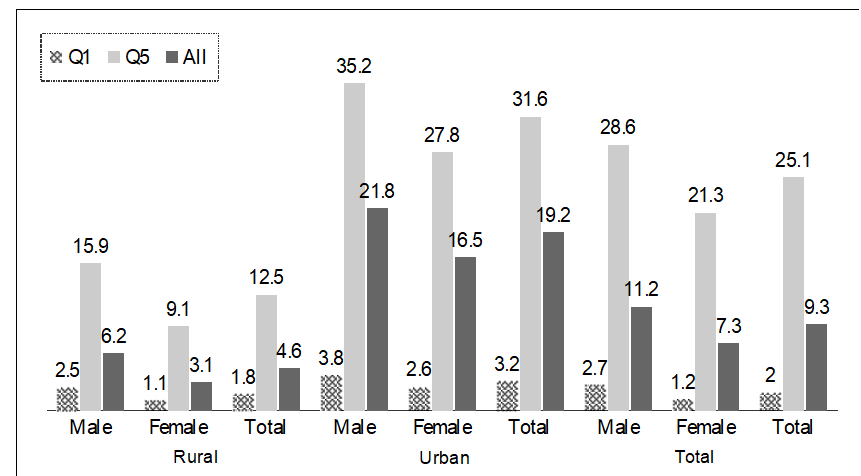
Source: Jandhyala B.G. Tilak and Pradeep Kumar Choudhury, Inequality in Access to Higher Education in India between the Poor and the Rich, Council for Social Development, New Delhi, 2019, http://csdindia.org.
These figures reinforce the conclusions from Chart 4.10. In 2013–14, just over 9 percent of adults had completed some form of post-secondary education. When disaggregated by income, the disparity is even more striking: 25 percent of the richest quintile had completed higher education, compared to just 2 percent of the poorest. Among the bottom 60 percent of the population, attainment was less than 4 percent (we have not given this data in the Chart, it has been taken from Tilak–Chaudhary’s article from which the above data has been taken).
A more recent study, based on PLFS data for 2017–18, estimates a modest rise in higher education attainment to 10.4 percent among those aged 15 and above.[75]
India’s higher education attainment rate is much below global standards. As can be seen in Chart 4.13, the average rate in developed countries is several times higher, the OECD average is four times greater, and the world average is three times that of India. India’s rate is near that of the sub-Saharan African nations—among the poorest in the world. For the bottom 60 percent of India’s population, the attainment rate is likely among the lowest globally.
Chart 4.13: Higher Education Completion Rate, India and Rest of World, 2022
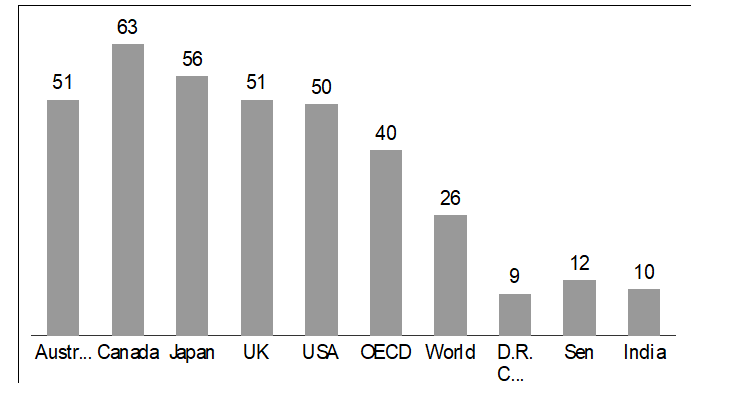
Source: Data for developed countries is for 2022, from: Education At a Glance 2023: OECD Indicators, https://www.oecd.org; data for world and Sub-Saharan African countries is for 2019 and is from: Global Education Monitoring Report 2021/2: Non-State Actors in Education: Who Chooses? Who Loses?, p. 433, https://unesdoc.unesco.org. Data for India is not available in the UNESCO report, so India data is for 2013–14 from J.B.G. Tilak, cited in Chart 4.12. It must not have increased, as GAR has declined.
v) Conclusion
From the above facts, we can draw the following conclusions about the private sector-led expansion of education in India since the 1990s, which has accelerated under the Modi Government:
- The biggest beneficiaries of privatisation are children from the richest quintile, the top 20 percent of the population, especially in urban areas, whose participation in higher education now rivals that of developed countries.
- The worst affected are children from the poorest quintiles. Urban poor have done only slightly better than rural poor. The GAR for the lowest two quintiles (bottom 40 percent) is similar to rates in the world’s poorest countries.
- NSSO data for 2013–14 and 2017–18 suggest that average GAR may be declining during the Modi years, indicating a possible fall in participation among the bottom quintiles. The Modi Government has since stopped releasing NSSO GAR data, so no figures are available after 2017–18.
- The percentage of population completing higher education, also called the Gross Completion Rate, in India is comparable to that of the poorest countries in the world.
- Tilak’s study does not break down GAR data by caste levels. However, as mentioned above, GER for SC and ST students is 2.5 and 7.2 percentage points below the national average. This disparity is clearly linked to the much higher poverty levels among these communities—a 2021 UN report says that half of India’s tribal population and a third of Dalits live in multidimensional poverty.[76] It is therefore very likely that GAR for SCs–STs is also below the national average, making them among the worst affected by commodification of higher education.
Scams Unlimited
With education turning into a business, it has also attracted fly-by-night operators looking to make a quick buck. Exploiting weak regulation, scamsters have set up fake universities and issued bogus degrees—for a price. From engineering to MBAs and PhDs, any degree is available for a fee. These scams are happening across the country. While some fraudsters are occasionally caught, a bigger issue remains: what happens to those who’ve already secured jobs, including government posts, with fake degrees?
A few examples:
- In 2019, investigations revealed that two private universities in Himachal Pradesh had sold thousands of fake degrees. Manav Bharti University in Solan had issued 36,000 fake degrees over seven years, charging Rs. 1–3 lakh per degree; while APG University in Shimla had sold 15,000 degrees.[77]
- In 2024, police in Rajasthan discovered that OPJS University in Churu had issued 43,409 fake degrees across 19 States since 2013. Investigators found that many recipients had secured government jobs. They also found that several private universities may have been involved in the scam.[78]
The apathy of higher education regulators and the government towards these frauds is clear from just one statistic: the UGC’s website lists 21 fake universities.[79] According to the newsportal Newslaundry, the UGC has been publishing a fake universities list since 1994, and remarkably, some institutions have remained on that list for years—with no action taken by either the UGC or the Centre.[80]
Notes
56. NEP, op. cit., pp. 33, 35, 36, 40.
57. Ibid., p. 35.
58. Ibid., pp. 34–35.
59. Ibid., pp. 48–49.
60. Soniya Agrawal, “11,050 Teaching Posts Vacant in Central Higher Education Institutes – DU, IIT-Kharagpur Top List”, 15 March 2023, https://theprint.in; “Over 5,000 Teaching Posts Vacant in Central Universities, Says Government”, 29 November 2024, https://thewire.in.
61. “Crisis in Varsities”, 24 October 2024, https://www.deccanherald.com; “Higher Edu Institutions Face Shortage of Quality Teachers”, 5 September 2024, https://timesofindia.indiatimes.com.
62. “Over 80% IIT, IIM Faculty from General Category Despite Reservation Mandates, RTI Reveals”, 3 December 2024, https://thewire.in; Varsha Sriram, “Vacancy Crisis: 38% Reserved Teaching Posts Still Vacant in Central Varsities”, 29 October 2024, https://www.thequint.com; “Those Snatching Central University Teachers’ Right of Reservation Lecturing Others: Kharge”, 2 November 2024, https://www.thehindu.com.
63. Niraj Pandit, “Around 60% Colleges in State Without NAAC Rating”, 4 January 2023, https://www.hindustantimes.com; “Why Many HEIs Lack NAAC Accreditation?”, 23 February 2023, http://timesofindia.indiatimes.com.
64. Accreditation Status, http://naac.gov.in, accessed on 24 July 2024.
65. Justice AK Rajan Committee NEET Report, https://archive.org. See also: Sreedevi Jayarajan, “Coaching Centres are Rs 5750 Cr Industry in TN Due to NEET: Justice AK Rajan Report”, 21 September 2021, https://www.thenewsminute.com.
66. “After NEP 2020, Scholarship and Research Fellowship Funds Declined by Over Rs 1,500 Crore”, 19 March 2024, https://news.careers360.com.
67. NEP, op. cit., p. 37.
68. Ibid., p. 44.
69. Santosh Mehrotra and Dr. Harshil Sharma, “Skill India Mission: Short Courses, No Employable Skills and a Lack of Jobs”, 21 March 2024, https://thewire.in.
70. Data given on the Dashboard of PMKVY website, https://www.pmkvyofficial.org. Accessed on 1 March 2025.
71. Santosh Mehrotra and Dr. Harshil Sharma, op. cit.
72. See our article: Neeraj Jain, “Union Budgets 2014 to 2024, Article 2: India’s Unemployment Crisis”, 12 January 2025, https://janataweekly.org.
73. AISHE reports, various years, available online at: AISHE Final Report, https://aishe.gov.in.
74. J.B.G. Tilak and Pradeep Kumar Choudhury, Inequality in Access to Higher Education in India between the Poor and the Rich, Council for Social Development, New Delhi, 2019, http://csdindia.org. Also note that in this data, higher education includes degree education and above. Diploma courses after graduation level are considered, diploma courses after higher secondary level (but below degree level) are not considered.
75. Vachaspati Shukla and Udaya S. Mishra, “Reading Progress in Attainment of Higher Education Goals in India: Features and Characteristics”, 15 March 2024, Council for Social Development, https://journals.sagepub.com.
76. “UN Report: One Third of India’s Dalits Remain Poor”, 23 November 2021, https://idsn.org.
77. “Fake Degrees Scam: HP Pvt University’s Assets Attached”, 31 January 2021, https://www.thestatesman.com; “Manav Bharti University Sold Fake Degrees in 13 States Through Agents, 16 Held”, 4 January 2022, https://www.tribuneindia.com.
78. “Over 43,000 Fake Degrees Issued by a Rajasthan University, Many Degree Holders in Secured Govt Jobs, Probe Launched”, 13 July 2024, https://www.businesstoday.in; “Fake Degree Racket: Edu Institutes Claim Records of Students Missing”, 4 November 2024, https://timesofindia.indiatimes.com.
79. State-Wise List of Fake Universities as on May 2024, https://www.ugc.gov.in, accessed on 7 February 2025; “Beware of These 21 ‘Fake Universities’ Offering Illegitimate Degrees Across India: Check Full List Here”, 21 November 2024, https://www.businesstoday.in.
80. Chahak Gupta, “UGC has Kept a List of Fake Universities for 25 years. Why Doesn’t It Act Against Them?”, 15 October 2020, https://www.newslaundry.com.
[Neeraj Jain is a social activist and writer. He is the convenor of Lokayat, an activist group based in Pune. He is also the editor of Janata Weekly, India’s oldest socialist magazine. He has authored several books, including Globalisation or Recolonisation?, Education Under Globalisation: Burial of the Constitutional Dream, Nuclear Energy: Technology from Hell, and most recently, Union Budgets 2014-24: An Analysis.]