
This post is an excerpt from a much more detailed State of the Climate 2023 report that I published over at Carbon Brief today. I thought it would be useful to have a more focused discussion here on why 2023 was so exceptionally warm and what that might entail for our estimates of where 2024 will end up.
Explaining 2023’s unusual heat
Scientists did not expect 2023 to be all that exceptional at the start of the year. As Carbon Brief reported at the start of 2023, four different groups provided temperature predictions for the year prior to any data being collected – the UK Met Office, NASA’s Dr Gavin Schmidt, Berkeley Earth and Carbon Brief’s own estimate.
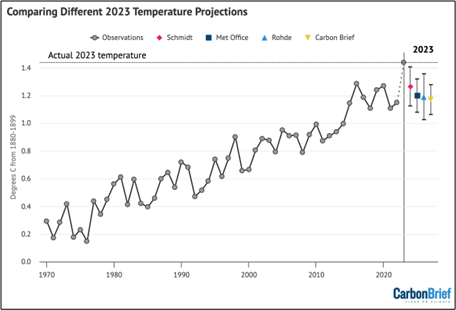
Temperature predictions for 2023 from the UK Met Office, NASA’s Dr Gavin Schmidt, Berkeley Earth and Carbon Brief relative to pre-industrial (1880-99) temperatures.
Chart by Carbon Brief.
As Carbon Brief noted in January 2023:
“La Niña conditions are expected to persist for at least the first three months of 2023. Because there is a lag of a few months between when El Niño or La Niña conditions peak in the tropical Pacific and their impact on global temperatures, these La Niña conditions will likely have a lingering cooling influence on 2023 temperatures.”
Carbon Brief estimated that 2023 was “very likely to be between the third and ninth warmest year on record, with a best estimate of being the fifth warmest on record – similar to 2022”, and suggest that if an El Niño develops in latter half of 2023 it would make it likely that 2024 will set a new record.
This estimate, alongside all the other groups predicting 2023 temperatures, was wrong. Not only did 2023 turn out to be the warmest year on record, but it fell well outside the confidence intervals of any of the estimates. And while there are a number of factors that researchers have proposed to explain 2023’s exceptional warmth, scientists still lack a clear explanation for why global temperatures were so unexpectedly high.
Over the longer-term, human emissions of CO2 and other greenhouse gases alongside planet-cooling aerosols are the main driver of global temperatures. Global temperatures have risen by approximately 1.3C since pre-industrial times as a result of human activity. However, on top of long-term warming, global temperatures vary year to year by up to 0.2C.
These variations are primarily driven by El Niño and La Niña events that redistribute heat between the atmosphere and oceans. However, other factors such as volcanic eruptions, the 11-year solar cycle and changes in short-lived climate forcers can influence year-to-year temperature changes.
The figure below, created by Dr Robert Rohde at Berkeley Earth, explores some of the main drivers of temperature change over the past decade.
These include continued accumulation of greenhouse gases, the evolution of El Niña and La Niña, and the 11-year solar cycle. It also includes two new factors that emerged during the decade: the 2022 eruption of the Hunga Tonga volcano and the 2020 phase-out of sulphur in marine fuels. Both of these are estimated to have relatively modest effects at present – less than 0.05C each – but with large scientific uncertainties.
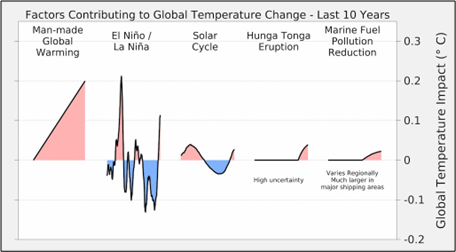
Illustration of contributing factors driving global surface temperatures over the past decade. Figure from Berkeley Earth.
However, both the Tonga eruption and the phase-out of sulphur in marine fuel are problematic explanations of extreme temperatures in 2023.
There is still a vigorous debate in the scientific literature about whether the eruption cooled or warmed the planet based on estimates of both sulphur dioxide and water vapour in the atmosphere, with some papers arguing for warming and others for cooling. Some modelling suggests that the largest impacts of the eruption would be in winter months, which does not match the timing of extreme summer temperatures experienced in 2023.
Similarly, the phase-out of sulphur in marine fuels occurred in 2020. If it had a large climate impact, it would show up in 2021 and 2022 rather than suddenly affecting the record in 2023. While it definitely has had a climate impact – alongside the broader reduction in aerosol emissions over the past three decades – the timing suggests that its likely not the primary driver of 2023 extremes.
Even El Niño – the usual suspect behind record warm years – does not clearly explain 2023 temperatures. Historically global temperatures have lagged around three months behind El Niño conditions in the tropical Pacific; for example, El Niño developed quite similarly in 1997, 2015 and 2023. But it was the following year – 1998 and 2016 – that saw record high temperatures.
The figure below shows the El Niño (red shading) and La Niña (blue) conditions over the past 40 years (collectively referred to as the El Niño-Southern Oscillation, or “ENSO”). While not unprecedented, the extended La Niña conditions since the latter part of 2020 have extended for an unusually long period of time.
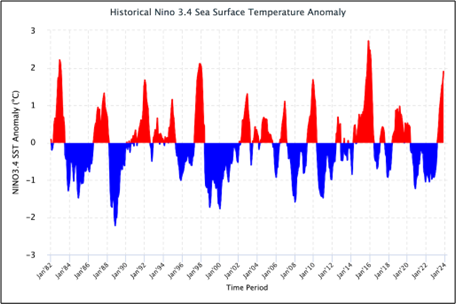
Niño3.4 sea surface temperature anomalies relative to the ocean average, for 1982-2023. Deviations below 0.5C and above 0.5C are generally used to determine La Niña and El Niño conditions, respectively.
Figure from International Research Institute (IRI) at Columbia University.
Carbon Brief has used this historical relationship between ENSO conditions and temperature to effectively remove the effects of El Niño and La Niña events from global temperatures, as shown in the figure below.
However, this approach – which has worked well for prior years – indicates that there would be almost no effect of El Niño on temperatures in 2023. This is because the lingering global temperature impact of La Niña conditions on the first half of the year would approximately cancel out the influence of El Niño on the second half. This model would suggest that the current El Niño event would primarily affect 2024 temperatures, analogous to what occurred in 1998 and 2016.
It is possible that this El Niño event is behaving differently and that the rapid switch from a rare and extended triple-dip La Niña event from late 2020 to the start of this year into strong El Niño conditions is resulting in a more rapid global temperature response.
But this remains speculative at this point and researchers are just starting to disentangle the causes of the unexpected extreme global heat the world experienced in 2023.
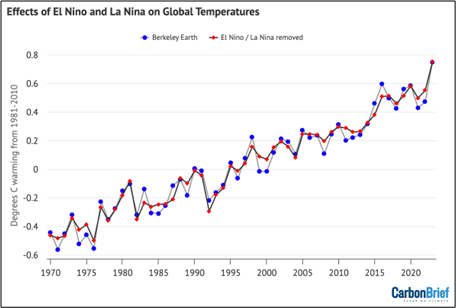
Annual global average surface temperatures from Berkeley Earth, as well as Carbon Brief’s estimate of global temperatures with the effect of El Niño and La Niña (ENSO) events removed using the Foster and Rahmstorf (2011) approach. Figures are shown relative to a 1981-2010 baseline. Chart by Carbon Brief.
Looking ahead to 2024
The unusual global temperatures experienced in 2023 makes it more challenging to predict what 2024 might have in store.
If history is any guide here, the year after the development of an El Niño event tends to be considerably warmer than the year in which it develops. For example, strong El Niño events developed over the latter half of both 1997 and 2015 and peaked early the following year, and 1998 and 2016 both set new records by a large margin.
However, 2023 was so exceptionally warm that it suggests that this El Niño might be behaving differently, with global surface temperatures responding more rapidly than in the past. If this is the case, 2024 would not necessarily follow the pattern of past El Niño events and is less likely to be substantially warmer than 2023.
There have been four published predictions – from the UK Met Office, NASA’s Dr Gavin Schmidt, Berkeley Earth and Carbon Brief (in this article) – of what temperatures might look like in 2024.
The figure below shows the four different 2024 predictions compared to the average of six different temperature records (NASA, NOAA, Hadley, Berkeley, Copernicus, and the Japanese JRA-55 reanalysis) used by the World Meteorological Organization (WMO). These have been “normalised” to show 2024 warming relative to 2023 in the WMO dataset. This is to remove any differences in predictions due to divergences in the baselines used by different temperature records.
Carbon Brief’s prediction of likely 2024 temperatures is based on a statistical model using the year, the average temperature of the past year, and projections of El Niño/La Niña conditions over the first three months to predict the temperatures of the year.
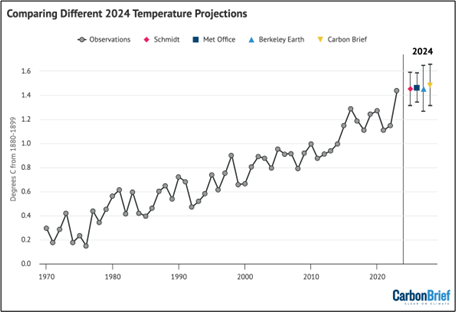
Temperature projections for 2024 from the UK Met Office, NASA’s Dr Gavin Schmidt, Berkeley Earth, and Carbon Brief, relative to pre-industrial (1880-99) temperatures and compared to the historical average of six different datasets produced by the WMO. Chart by Carbon Brief.
The Met Office, Dr Schmidt, Berkeley Earth and Carbon Brief estimates all have 2024 as more likely than not to be warmer than 2023 – but only by a small margin. In all estimates it is close to a coin flip which will end up as the warmer year.
Against a 1880-99 pre-industrial baseline, the central estimate of all four forecasts is just below 1.5C of warming, with ranges suggesting that temperatures could top 1.5C next year.
However, the poor performance by all of these groups in accurately predicting 2023 temperatures mean these should be treated with some caution. Until scientists have a clearer understanding of the drivers of the unusual warmth the world experienced in 2023, it will not be possible to fully predict how temperatures will evolve in 2024 as the current El Niño event peaks and fades away.
Ultimately, what matters for the climate is not the leaderboard of individual years. Rather, it is the long-term upward trend in global temperatures driven by human emissions of greenhouse gases. Until the world reduces emissions down to net-zero, the planet will continue to warm.
As the chart below highlights, if the warming trend over the past 40 years continues, average surface temperatures are likely to pass 1.5C in the early 2030s and 2C by around 2060.
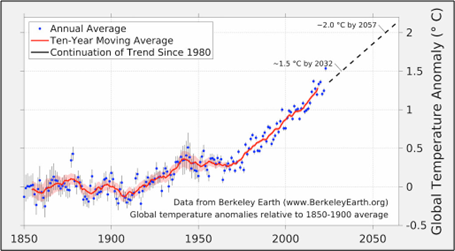
Expected exceedance years of 1.5C and 2C given a continuation of the long-term warming trend. Note that exceedance is defined as the long-term average temperature, rather than any individual year. Figure from Berkeley Earth.
(Zeke Hausfather is a climate scientist and energy systems analyst whose research focuses on observational temperature records, climate models, and mitigation technologies. He spent 10 years working as a data scientist and entrepreneur in the cleantech sector, where he was the lead data scientist at Essess, the chief scientist at C3.ai, and the cofounder and chief scientist of Efficiency 2.0. He also worked as a research scientist with Berkeley Earth, was the senior climate analyst at Project Drawdown, and the US analyst for Carbon Brief. Courtesy: The Climate Brink, a climate blog.)