Welfare Spending in the Past Two Decades: Has the NDA Era Been Different?
Reetika Khera and Md. Asjad
The years of the National Development Alliance (NDA) government are often lauded in the mainstream media as years with a generous welfare agenda.
Budgetary allocations do not support this assessment.
There is little difference in the combined spending on 10 major welfare schemes in 2023–2024, as a percentage of GDP, from where it was 20 years ago in 2004–2005, our analysis here will show. Schemes associated with the United Progressive Alliance (UPA) government (2004–14) witnessed a squeeze in funding. The fiscal space created was filled in with schemes associated with the successor NDA government, leaving the total unchanged.
Contrasting models?
Here, we compare the NDA years (2014-2024) with the years of the prior UPA government. We also try to look at a break-up of overall welfare spending, by classifying the schemes into two broad categories – those associated with the UPA government and the other set with the NDA government.
Anand, Dimble and Subramanian (2020) assess that during the NDA regime, private goods (toilets, housing, LPG cylinders, and water connections), rather than public goods such as health and education have been emphasised by the government. They label this as ‘new welfarism’.
Following them, for the NDA period, we include as ‘NDA schemes’ the Swachh Bharat Abhiyan (SBA) launched in 2014, PM-Awas (urban) in 2015, and PM-Awas (rural) the following year along with the Pradhan Mantri Ujjwala Yojana (PMUY). In 2018, PM-Kisan Samman Nidhi (PM-Kisan) and Ayushman Bharat were initiated, and in 2019, Jal Jeevan Mission (JJM).
Five major programmes associated with the UPA period are the National Rural Employment Guarantee Act (NREGA) 2005 and four schemes of the National Food Security Act (NFSA) 2013: the Public Distribution System (PDS), Mid-Day Meals (MDM), Integrated Child Development Services (ICDS),[1] and maternity entitlements (provided through the Pradhan Mantri Matru Vandana Yojana that became operational very belatedly in 2017).
However, several of the so-called NDA schemes existed in the UPA years, with different names (Swachh Bharat was Nirmal Bharat, PM-Awas was Indira Awaas, and so on) and lower budgets. In fact, the renaming of schemes has been a major feature of the past 10 years.[2] The NREGA of UPA was modelled on earlier drought relief public employment works and made a legal entitlement. The same is true for the NFSA that converted three pre-existing schemes (PDS, MDM and ICDS) into legal entitlements. The PMMVY was the only new addition in the NFSA. PM-KISAN is a new scheme introduced in the NDA years whereas the others existed in some form even earlier.
The classification of schemes as NDA or UPA is therefore somewhat artificial. It is not so much about who introduced each scheme, rather how well they were funded in the past two decades.
There are some differences between these two sets of schemes. The NDA schemes follow a ‘saturation’ approach that allows an element of ‘self-targeting’. Only those who do not have a toilet or pukka room or LPG connection, etc. are eligible, and once they receive it others get a chance, i.e., the benefits are one-time benefits.
In the case of both UPA benefits, entitled people get benefits enshrined in these laws year after year (100 days of work for rural families), or month after month (PDS grains) or daily (meals in schools and at anganwadis). Here too, there is some self-targeting, in the sense that only those who cannot get any other work show up for NREGA work and children in government schools and anganwadis tend to be from poorer families.
We extend earlier work by Verma and Suhel (2023) in two ways: one, instead of looking at a 10- year period (2014–2023), we look at a 20-year period (2004–2024). Two, the schemes covered here include those that have been associated with the NDA regime and have seen increased funding during the past decade. We ignore health and education because there has not been any substantial change in them in the period under consideration.
Some caveats on expenditure data
For the PDS, we use the food subsidy in its entirely even though it is the sum of a subsidy to consumers, producers (i.e., the share of farmers when they sell wheat and rice to the government at Minimum Support Prices), and administrative costs. Apportioning the food subsidy into these three components is not straightforward. However, including only half of the food subsidy (as an approximation of the consumer subsidy) does not make much difference to the results. Similarly, for Ujjwala Yojana we use the LPG subsidy, though only a small part it is spent on Ujjwala Yojana.
One further caveat regarding the food subsidy is that a change in the manner in which it is reported coincided with the first Covid-19 year (2020–21). Thus, the spike in welfare spending that year is on account of an actual increase in the food subsidy as well as the change in recording it.[3]
We exclude Ayushman Bharat in our analysis for two reasons. One, the total expenditure on Ayushman Bharat during 2019-2024 was quite small: Rs. 32,000 crores, i.e., half of the annual expenditure on PM-Awas, averaged over the same period. (Even if we add it as an NDA scheme, little changes). Two, Ayushman Bharat is part of the health spending, and if we include it then for the sake of comparability, we should include the budgets allocated for the National Rural Health Mission (NRHM) during the UPA years.
Finally, for some schemes cost-sharing norms changed after the Fourteenth Finance Commission increased the share of revenues that would devolve to the states. The centre reduced its obligations to 60% from 75–90% in some cases. (Table 1 in the appendix shows some of the changes in the cost-sharing norms that occurred around 2015.) Though the focus here is on welfare spending in the Union Budget, as a check, we scale up the total (Union plus State) budgets on MDM, ICDS, and PMMVY by assuming that the states contribute their stipulated share. Doing so also does not change the picture substantially. (See Chart in the appendix.)
How has welfare spending changed?
We present our results for UPA and NDA, bearing in mind all the caveats discussed above.
The top line in Chart 1 shows the combined welfare expenditure: the level of welfare expenditure is low and stagnating, in spite of good GDP growth in this period. It exceeds 3% of GDP only for one of the two Covid-19 years. Whatever increase there was over the longer period, occurred during the initial UPA years.
Chart 1: State of Welfare: UPA and NDA regimes
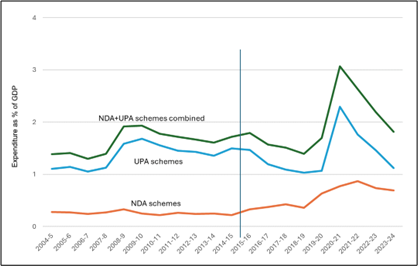
‘UPA’ includes food subsidy, MGNREGA, Mid-Day Meals, ICDS and PM-Matru Vandana Yojana. ‘NDA’ includes Swachh Bharat Mission, PM-Awas, PM-Kisan, Jal Jeevan Mission and LPG subsidy.
Sources: Union Budget, various years. When actuals were unavailable, Revised Estimate (RE) is used. Where RE is not available, Budget Estimate (BE) is used.
In contrast to NDA schemes, none of which are legal entitlements, the UPA schemes are enshrined in law, so it is not easy to defund them entirely. The former, thus, are much more like ‘freebies’ or ‘revdis’ in the sense that they depend on the whims of the government.
In spite of the legal compulsions, UPA schemes (middle line in the chart), especially those for children, suffered budgetary neglect under the NDA. The cuts were drastic in the case of Mid-Day Meals and the ICDS. In real terms, it declined by 40% (compared with 2014-15). The share of the UPA schemes in the Union budget declined gradually from around 1.5% of GDP in 2014 to 1.1% of GDP in 2019-20, when Covid forced the government to ramp it up.
Did NDA schemes compensate for the decline in NDA government spending on UPA schemes? Just about. Though spending on NDA schemes (bottom most line in the chart) rose steadily in the past decade, it remained below 1% of GDP.
This explains the modest achievements of these schemes. According to the National Family Health Survey, LPG usage increased to 58% in 2019–21 (the most recent year for which the data is available) from 43% in 2015–16. In the same period, the proportion of households practising open defecation has halved (to 19% from 39%) and those residing in pukka homes has increased to 60% from 56%.
In fact, precisely because the NDA did not compensate for the UPA schemes, during Covid-19 the NDA government relied heavily on two big UPA initiatives, including the NREGA that it vociferously attacked. (In 2015, the prime minister had labelled it a symbol of the Congress’ failures.)
The NDA’s fraught relationship with UPA schemes is more evident in the case of the PDS, that now goes by the name of Pradhan Mantri Garib Kalyan Anna Yojana (PMGKAY). The NFSA 2013 mandated 50% coverage in urban areas and 75% in rural areas (800 million in all), with 5kg per person per month at Rs. 2 per kg for wheat and Rs 3 for rice, for those covered by the PDS.
During Covid-19 (April 2020 to December 2022), the government doubled people’s PDS entitlements, providing the extra 5 kg free. When this top-up was discontinued in 2023, to blunt the blow the original NFSA entitlement of 5 kg was made free. This repackaged PDS, that saved each person an additional Rs. 15 a month at the most, was renamed the PMGKAY.
Facts aside, a UPA legislation (the NFSA 2013) enabled the current coverage of 800 million through the PDS (up from about 500 million when the act was passed). It is now associated much more with the BJP and Narendra Modi than the UPA and Congress.
This is astounding because while the NDA claims benefit for so little, it has left out millions from the PDS quota, which was last fixed after the 2011 Census. The failure to conduct the 2021 Census has resulted in the exclusion of millions from the PDS. Applying NFSA mandated coverage ratios (50% in urban and 75% in rural areas) to the projected population in 2021 would have added more than 100 million to the PDS.
State initiatives
The silver lining is that several state governments, especially those ruled by non-BJP parties, have stepped up. For instance, while the union government has barely increased per child cooking costs for school meals, even poorer states such as Odisha, Bihar, and Jharkhand have managed to provide eggs a few times a week in the MDM and ICDS.
Many states also provide top-ups to social security pensions, where the central contribution to some categories has stagnated at Rs 200 per month since 2007. The union provided only 24% out of the total expenditure between 2017–2021 on the National Social Assistance Programme (NSAP), which provides social security pensions to the elderly, widows, persons with disabilities etc., according to a CAG report. In Jharkhand, the state government contributes Rs 800 so that pensioners get Rs. 1000 per month. Equally important, several states have increased coverage – substantially – through state schemes. Odisha’s Madhu Babu Pension Yojana supports 58% of pensioners in the State. In Rajasthan, 87% of all social security pensioners are supported through a state scheme.
Odisha and Tamil Nadu provide higher amounts (Rs. 10,000 and Rs. 18,000–24,000, respectively) as maternity entitlements to pregnant and lactating women through their state schemes (Mamta and Dr. Muthulakshmi Reddy Scheme) than the central scheme, PMMVY.
Concluding remarks
Some have argued that as the economy grows, even 1–2% of GDP is a much larger amount today than it was 20 years ago. According to the same observers, given that per capita GDP has also risen, there is nothing wrong if as a percentage of GDP welfare spending is stagnating.
This line of thinking is wrong on at least three counts. One, it assumes that when GDP grows, everyone gets an equal share of the larger pie. We know that this is not true in the Indian case where inequality has been rising (see Bharti, Chancel, Piketty and Somanchi 2024). Two, the past decade has seen major economic disasters: demonetisation, haphazard implementation of GST and the humanitarian crisis arising from the Covid-19 lockdowns. All three necessitated greater social support. Finally, as an economy grows, one expects more – not less – generous welfare spending.
The NDA government has managed to build a reputation as a big welfare spender by renaming existing welfare programmes and then claiming credit for them (as if they are new schemes). At the same time, it has been starving the pre-existing welfare structure of funds without compensating for it with something of its own.
Notes
- For 2020-21, the figure for ICDS was not available from the budget documents. In the CPR’s budget briefs, it is given as Rs. 20,105 and in a PIB press release based on a Rajya Sabha reply, it is Rs. 15,798. We use the latter.
- Post-2014, UPA schemes continue with similar levels of funding as before and new names. For instance, MDM is POSHAN and the Public Distribution System (PDS) is the Pradhan Mantri Garib Kalyan Anna Yojana (PMGKAY).
- In 2020-21, the government repaid its debt to FCI that had been accumulating over the years. See Haq. Therefore, the food subsidy shot up from Rs. 108,688 crores (in 2019-20) to Rs. 541,330 crores (2020-21); in 2021-22, it was Rs. 288,969 crores. (The revised estimates for 2020-21 is recorded in the 2021-22 budget (BAG) as Rs. 422,618. In the following year (2022-23), the actual for 2020-21 rises again to the BE stated earlier (BAG).) For 2020-21, we use a simple average of the food subsidy for three years – 2019-20, 2020-21 to 2021-22.
(Reetika Khera is with IIT Delhi. MD. Asjad is a student at Jamia Milia Islamia. Courtesy: The India Forum, an independent online journal-magazine that seeks to widen and deepen our conversations on the issues that concern people.)